Risk Goes from Slow to Fast
Bear markets reveal two conceptually correct concepts about the nature of risk.
1) Risk/surprises happen in the direction of the trend. In bear markets these “surprises” seem more dramatic because markets do down faster than they go up.
2) Sometimes risk is just risk and cannot be hedged.
A week ago we walked through the behavior of the SPX as to its 200 day moving average since the January 2022 all-time high.
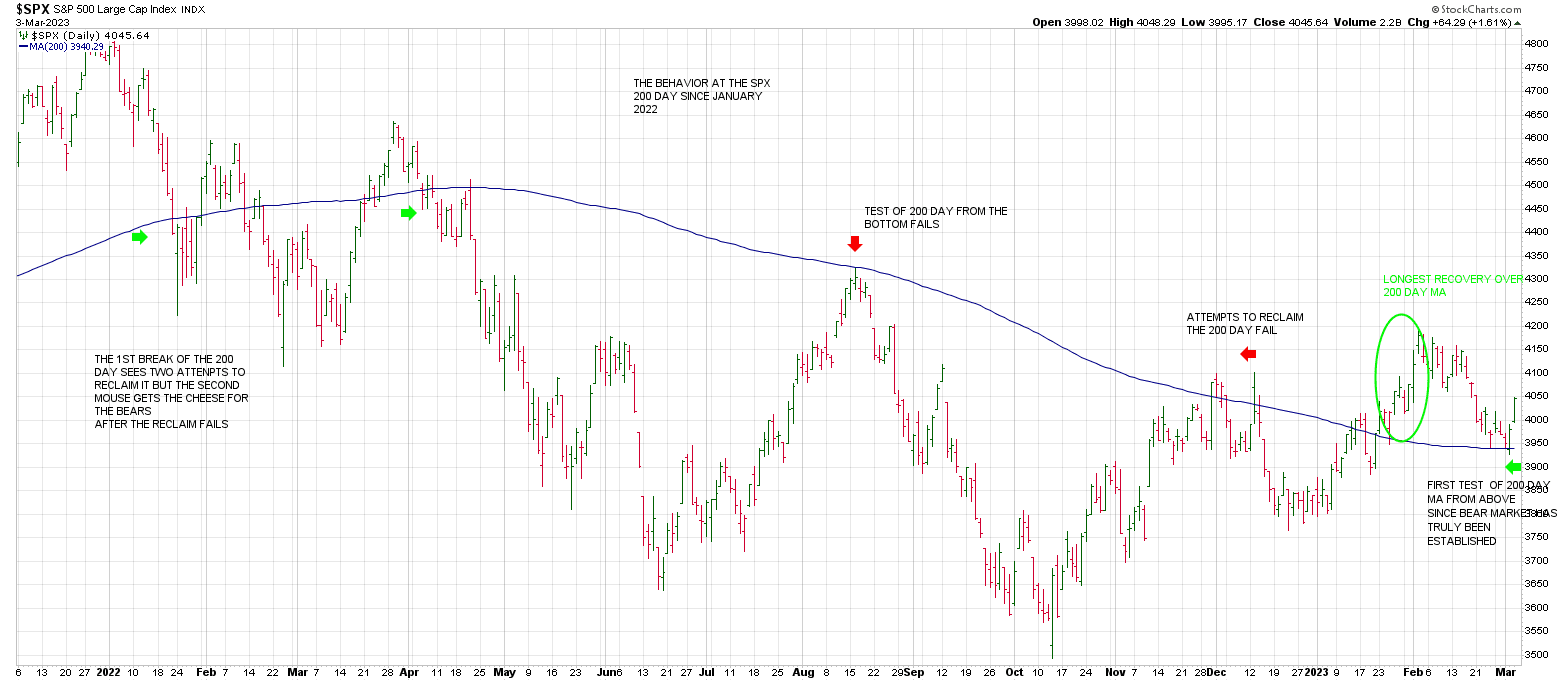
Notice that the longest (duration) rally over the 200 day moving average since the January 2022 all-time high started on January 23. The rally peaked on February 2 but held up until February 15, rolling over on February 15. “Two weeks on the side” As WD Gann would say.
Thursday was an important day in many respects. But what we’re focusing on here is that the SPX closed back below its 200 day moving average on Thursday.
I believe the time spent above the SPX 200 day moving average is the longest during a bear market.
Moreover, the SPX closed below the “close only” trend line from the October low that we’ve defined as the Bull/Bear Maginot Line.
That line was at 3960. The SPX closed at 3918, convincingly below 3960.
On Thursday the SPX triggered a Rule of 4 Sell signal breaking a rising 3 point trend line connecting the October low close of the Bear with the December low close.

Judging by the twittersphere, there were many market participants/ technicians who turned uber-bullish on the Breakaway Momentum (BAM) or Breadth Thrust “signals’ in the January rally.
Yesterday it looks like BAM turned to DAM (Down Action Momentum).
Follow Thru is always key of course but if we get downside follow-through today, those BAM Believers still holding onto hopium for a Return To Normal will likely puke up their positions before the weekend.
So if the market is under selling pressure in the last few hours today, pressure could intensify on the runoff.
If so, the pattern is reminiscent of the Thursday/Friday in October, 1987 leading to Black Monday, October 19. The key will be accelerated momentum below the 200 day moving average.
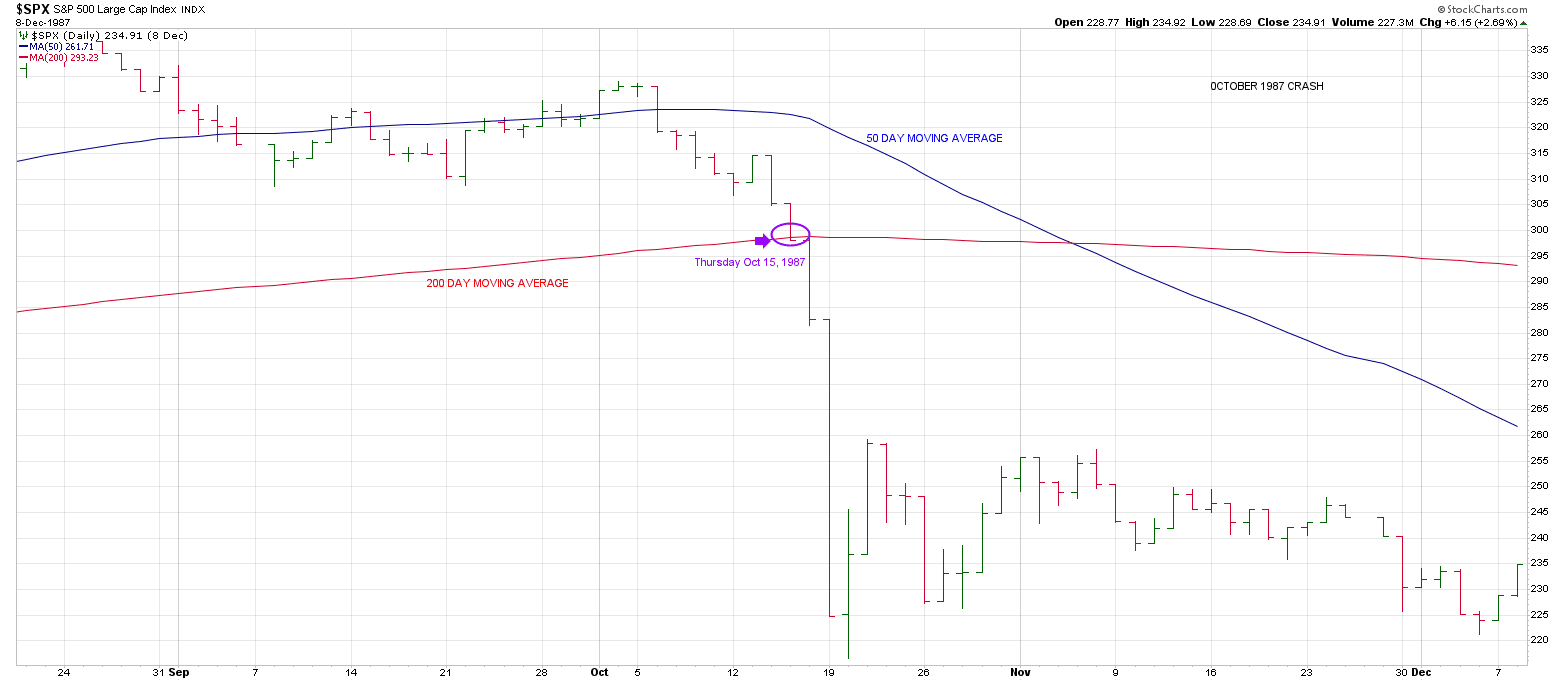
Notice the breakage below the 200 day moving average preceding Black Monday.
As to 1987, it exemplifies the aforesaid concept 2 that sometimes risk is just risk and can’t be hedged away.
In 1987 the culprit was Portfolio Insurance.
Big money assumed and assured themselves they were hedged.
They were until they weren’t.
Extreme market moves have a way of triggering fault lines… both in market structure and psychology.
Interestingly, 1987 was 36 years ago.
Anchoring to 36 on my Square of 9 Wheel “points to”, aligns with mid-February and mid-May.

Mid-February is when the last rally rolled over perpetuating the drop we are currently in.
May is when my work indicates a Panic Cycle will hit.
For one reason, this May is 15 years from mid-May 2008 when the crash leading to the Lehman debacle started.
15 years is ¼ or 90 degrees of W D Gann’s Master 60 Year Cycle.
Mid-May is also the anniversary of the start of the NYSE on May 17, 1792.
On my Square of 9 Wheel, the number 231 is 180 degrees straight across and opposite April 4.
So early April is on the radar and sets up as another time period to watch where volatility and risk rise.
Importantly, April is 180 degrees straight across and opposition last October.
So there is a lot of synergy with this April/May time-frame with historic cycles and current cycles.
In sum, risk is on the radar technically and with the news backdrop visa vis Silicon Valley Bank.
Panic is contagious. Big Money assumes it is hedged. But what if the institution they are hedged with has counter-party risk and the hedges are in jeopardy.
Then urgent selling enters and folks sell what they can, not what they want to
As I offered in Thursday’s Hit and Run Morning Report, The News Breaks With The Cycles, Not The Other Way Around, “Markets seem on a trajectory lower into cycles we have been eyeing that exert their influence into March 15-17th. While the 3960 three point close only trend line is going to trigger a Rule of 4 Sell when it breaks, I don’t know if it is going to break on the slew of economic “news” on deck, but it’s going to break.:
Caution is warranted. From the 4195 rally high on February 2, one 360 degree price cycle down is precisely 3940 and the 200 day moving average.
Thursday’s close at 3918 broke that pivot with authority opening the door to the June low which ties to the high of the low bar day, October 13.
Conclusion. Extreme news breaks with Panic Cycles.
From the February 2 rally high, the Gann Panic Zone culminates around March 24-27.
March 24 is the anniversary of the Bubble Top in 2000.
That was 23 years ago. On the Square of 9 Wheel Of Time & Price, the number 23 squares March 24.
This March, April, May looks like it’s going to see intense swings.
Lastly, this morning we get the Jobs Report. If the market should snap back on the report, it may backtest the 3940-3960 Maginot Line Of Risk.
Thursday the market snapped back too on news that jobless claims showed a sharp increase.
The market rallied momentarily thinking that this would keep the Fed at bay.
However, we’re in a cycle where bad news is bad news.
The Fed is a fire fighter now, fighting “inflation.” They’re not the bringing the Punch Bowl to the Equity Prom
On every dip.