Capitulation On Deck
- April 18, 2022
- / By Jeff Cooper
If the biggest bond market crash in 40 years in 2022 is going to see the stock market maintain their sideways trading range, good luck.
In sum, there is no real fear.
Why?
Arguably, from a contrary opinion point of view, it may be “encouraging” that, according to the American Association of Individual Investors (AAII) survey, the percentage of bulls has now nosedived to 15.8%, which is the lowest such figure in close to 30 years (since Sept. 1992).
However, these surveys measure what people say, NOT WHAT THEY DO with their money.
Put/call ratios, which measure what market participants actually do with their money, have not registered levels that market real fear this year.
What will be needed to see real fear to mark the first intermediate term low of the bear market?
I think it will take a bust of what many pundits and strategists have been quick to call the low for the Bear… the March lows.
It will take a bust of what bulls presume is a wide and loose base building trading range since February/March.When that base busts, we should get momentous capitulation.
Most players still are extrapolating the behavior of markets in 2020.
That wasn’t a bear market. That was a crash, like 1987.
Arguably, the parabolic move in stocks during the pandemic was the Mother of Walls of Worry: if the market could climb that vertical wall, every subsequent down draft “must be” an opportunity?
This psychology was further propagated by the Fed Put: that the Fed would come in on any setback to rescue markets.
The Fed’s presumption was they had the latitude to do so because inflation was low and they had this agenda for 2% inflation. Boom. Unintended consequences and 8 1/2 % inflation.
The pandemic surge in debt driven mass consumption of goods and mass hysteria in stocks sold as recovery by The Street was consistent with a blow-off where the SPX more than doubled in 94 weeks.
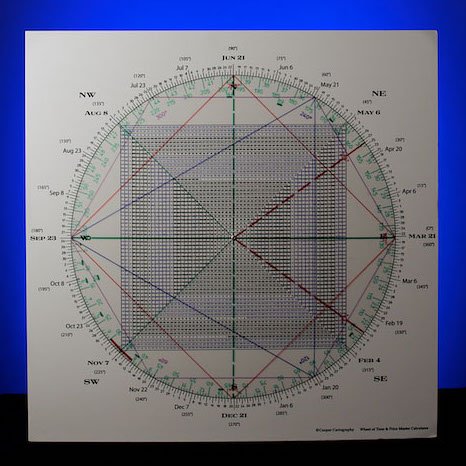
Another factor pointing to January as marking the high for this cycle is that checking a Square of 9 shows that 94/95 is 180 degrees straight across and opposite early January when the SPX struck its ATH.

Blue early January
Red 94/95
Parabolic moves typically return to the scene of the crime, where they started.
Is it possible before the Bear market is going to see the SPX revisit the 2200 region?
That said, by virtue of the Principle of Squares as revealed by the Square of 9 Wheel, the 4818 ATH was nailed and is the high for this cycle.
That is because 6 full cycles of 360 degrees up from MONTHLY pre-pandemic high around the 3295 region ties to the 4818 all time high.
If prior resistance at 3250-3300 does not act as support in the Bear, it opens the door to a drop to the March 2020 lows around 2200.
If you’re looking for a rationale: the chart below shows the U.S. average annual mortgage payment is now 35% higher than the mortgage bubble in 2006.

There is a difference: in 2022, we have 8.5% inflation and 50x the debt with the Fed behind the curve.
Watch gold and silver.
A monthly GLD shows it has not seen a monthly close over 183.

A monthly close over 183 will be a triple top breakout over monthly Topping Tails.
188 is currently a key level as defined by the Square of 9 Wheel.
From the last major swing low of 157 in March 2021, the Square of 9 shows that 180 degrees up and opposite is 183.

I think gold is going to shock bulls and bears alike as it clears and sustains 183.
Below is a daily QQQ from November 2021 showing the ATH and Head & Shoulders Top.

It’s a bearish occurrence that the Q’s turned their 3 Day Chart down immediately off the false breakout recovery high on March 29.
Remember this was right in the target window of a cluster of turning points.
As well, the Square of 9 below shows that 317/March 14 low was a Time/Price 90 degrees square-out.
Importantly, straight across and opposite the March 14 low is 372… the recovery high on March 29 with 372 being 270 degrees in price up from the 317 low for the year.

Red March 14
Purple 317
Blue 371
Notice the bearish price action on the above daily QQQ.
After the Monthly Swing Chart turned up on March 29:
1) The 3 Day Chart immediately turned down.
2) After a one day sharp rally where the dailies turned up in league with a kiss goodbye of the 200 day ma, the Q’s turned down with authority
3) The next session, April 6, the Q’s saw a Gap & Go to the downside
4) Again after a one day rally attempt that could NOT satisfy a subsequent turn up of the dailies.
5) We got another Breakaway Gap on April 11.
6) After Phil D Gap on April 12, where the Q’s turned their Daily Swing Chart up once again, another downside reversal occurred, leaving a large range outside down day (LROD).
7) Yet another ensuing sharp rally attempt played out last Wednesday that could not get traction. These upside blasts peter out.
8) As a result, the Q’s nosedived again on Thursday closing below the January closing low of 341, a level we have continually stressed that breakage below could see accelerated momentum. The QQQ closed below 341 on the weekly closing basis last week, suggesting downside follow through this week. A clear failure below the January closing low triggers my Blade Runner sell pattern. This is a failure of a “perceived” inverse Head & Shoulders. Fast moves come from failed patterns.
It’s an ongoing short term negative that despite becoming oversold, all the popular averages continue lower: the most bearish thing a market can do is get oversold and stay that way. The inverse is true for bull markets.
A few hours/days of rally takes the “pedal off the metal” just enough to elicit some hope on the downward slope.
Conclusion. Downside momentum today could lead to a Black Monday in keeping with the aforesaid ugly price action since the March 29 false breakout and our Blade Runner pattern.
If the indices trigger Opening Range Breakouts (to the downside) and continue lower after the first hour, caution is warranted. The SPX holding below 4410 and QQQ holding below 339 opens the door to new lows for the year.