The Crash Level You Need to Know About
- March 7, 2022
- / By Jeff Cooper
In February, we noted the significance of the SPX 4410 region.
This is a key 540 degrees down from the 4818 ATH in early January.
In my research for the seminar/DVD, Unlocking the Profits of the New Swing Chart Method with David Reif, which analyzed the SPX swings from 1941, I noticed how many swings in both time and price there were of 540 degrees.
Of course, 540 days degrees is 18 months, which is a fractal of the 18-19 year major cycle.
Price moves according to the Principle of Squares in a logarithmic, not a linear pattern. 540 degrees is a true square… a cube.
The SPX dropped below 4410 on a massive gap on Monday, January 24 and reversed to close near session highs at precisely 4410.
Happenstance? My 35 year career as a trader using the Square of 9 Wheel of Time & Price says no way.
On Wednesday, February 23, the SPX closed near the low for the move (Jan 24) and saw another massive gap down the next day, February 24.
Another large reversal day played out as the SPX knifed back up through the January 24 low, triggering a Soup Nazi Reversal… as in “no soup” for the bears. Once again, the index closed at/near session highs and went on to rally and Pinocchio 4410 with a high of 4416 before rolling over to close 4363.
With two large range reversals on the clock from January 24 and February 24, as I write Sunday night, the market is set to gap down with authority again on Monday’s open.
If February 24 represented a 5 Wave decline from the early January ATH, then the presumption is that March 3 marked the high of a corrective Wave 2.
If so, a powerful Wave 3 decline started on Thursday which will carry to new lows.
Alternatively, another stick save today could perpetuate another swing high for the Wave 2 corrective rally.
Above, we noted that 4410 is 540 degrees down from the all-time SPX high.
Another 540 degree decline or 1080 down from high is 4020.
Interestingly, a weekly SPX from early 2018 shows a Ghostline connecting the 2018 peak with the Feb 2020 peak comes in at around 4020.
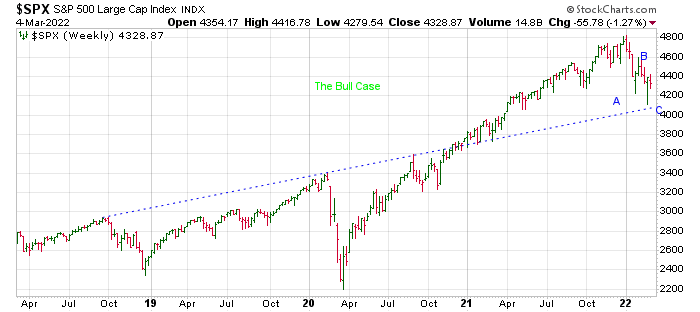
Note the pivot this Ghostline tags in the fall of 2020.
A 3rd drive to 4020 is the bull case.
Breakage below this 4020 region opens the door to a full blown crash.
In sum, with the two previous gap downs on January 24 and Feb 24 representing early session lows and large range reversals, I can’t help but wonder if this 3rd gap down may find that the high of the day is near the open… i.e., a Gap & Go to the downside?
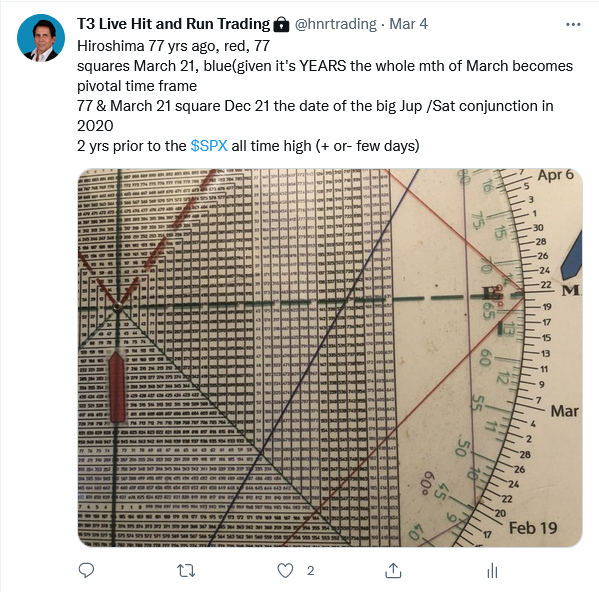
March 2022 is set to be a big turning point.
13 Fibonacci years ago, in 2009 ,March 6-9 was a bear market low. Since the orthodox primary high in the SPX occurred on November 22, 2021 and 13 years prior was the primary bear market low on November 21, 2008, the next week or two sets up a a big inflection point. It could be a Selling Climax or a Wave 3 rally high.
Regarding the November 22, 2021 turning point, this is where the NDX struck its ATH.
It has already seen a 22% crash in less than 4 months.
The NDX just triggered a Death Cross where its 50 day moving average dropped below its 200 day moving average.
History tells us this is in keeping with a 6 to 12 month bear phase.
Hit & Run members have been crushing it with long index puts and long VXX, as well as short individual equities, long miners, FNV, AEM, AG and GLD calls and GDXJ.
Despite the strength in the dollar, PM miners and metals have been surging. Dollar strength has kept many players out of the metals.
It just goes to prove my market axiom that correlation kills.
Market participants love reasons and correlations, but in my experience, when these “correlations” crack the popular consensus, major moves often erupt.
While most on the Street were moaning when GDXJ was making a new low in late January, we wrote that a Trap Door buy set up may be staring us in the face on a reversal back up through 38.50/39.
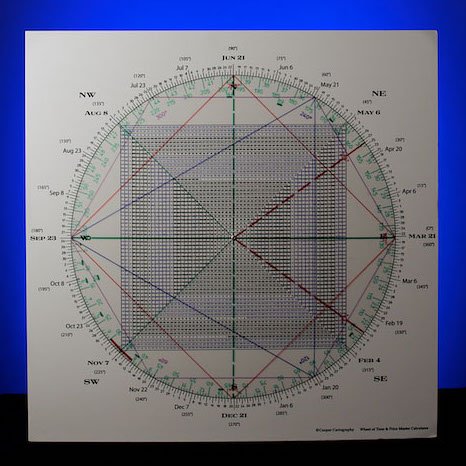
The confidence for such a call came from my Square of 9 Wheel of Time & Price.
Here’s why:
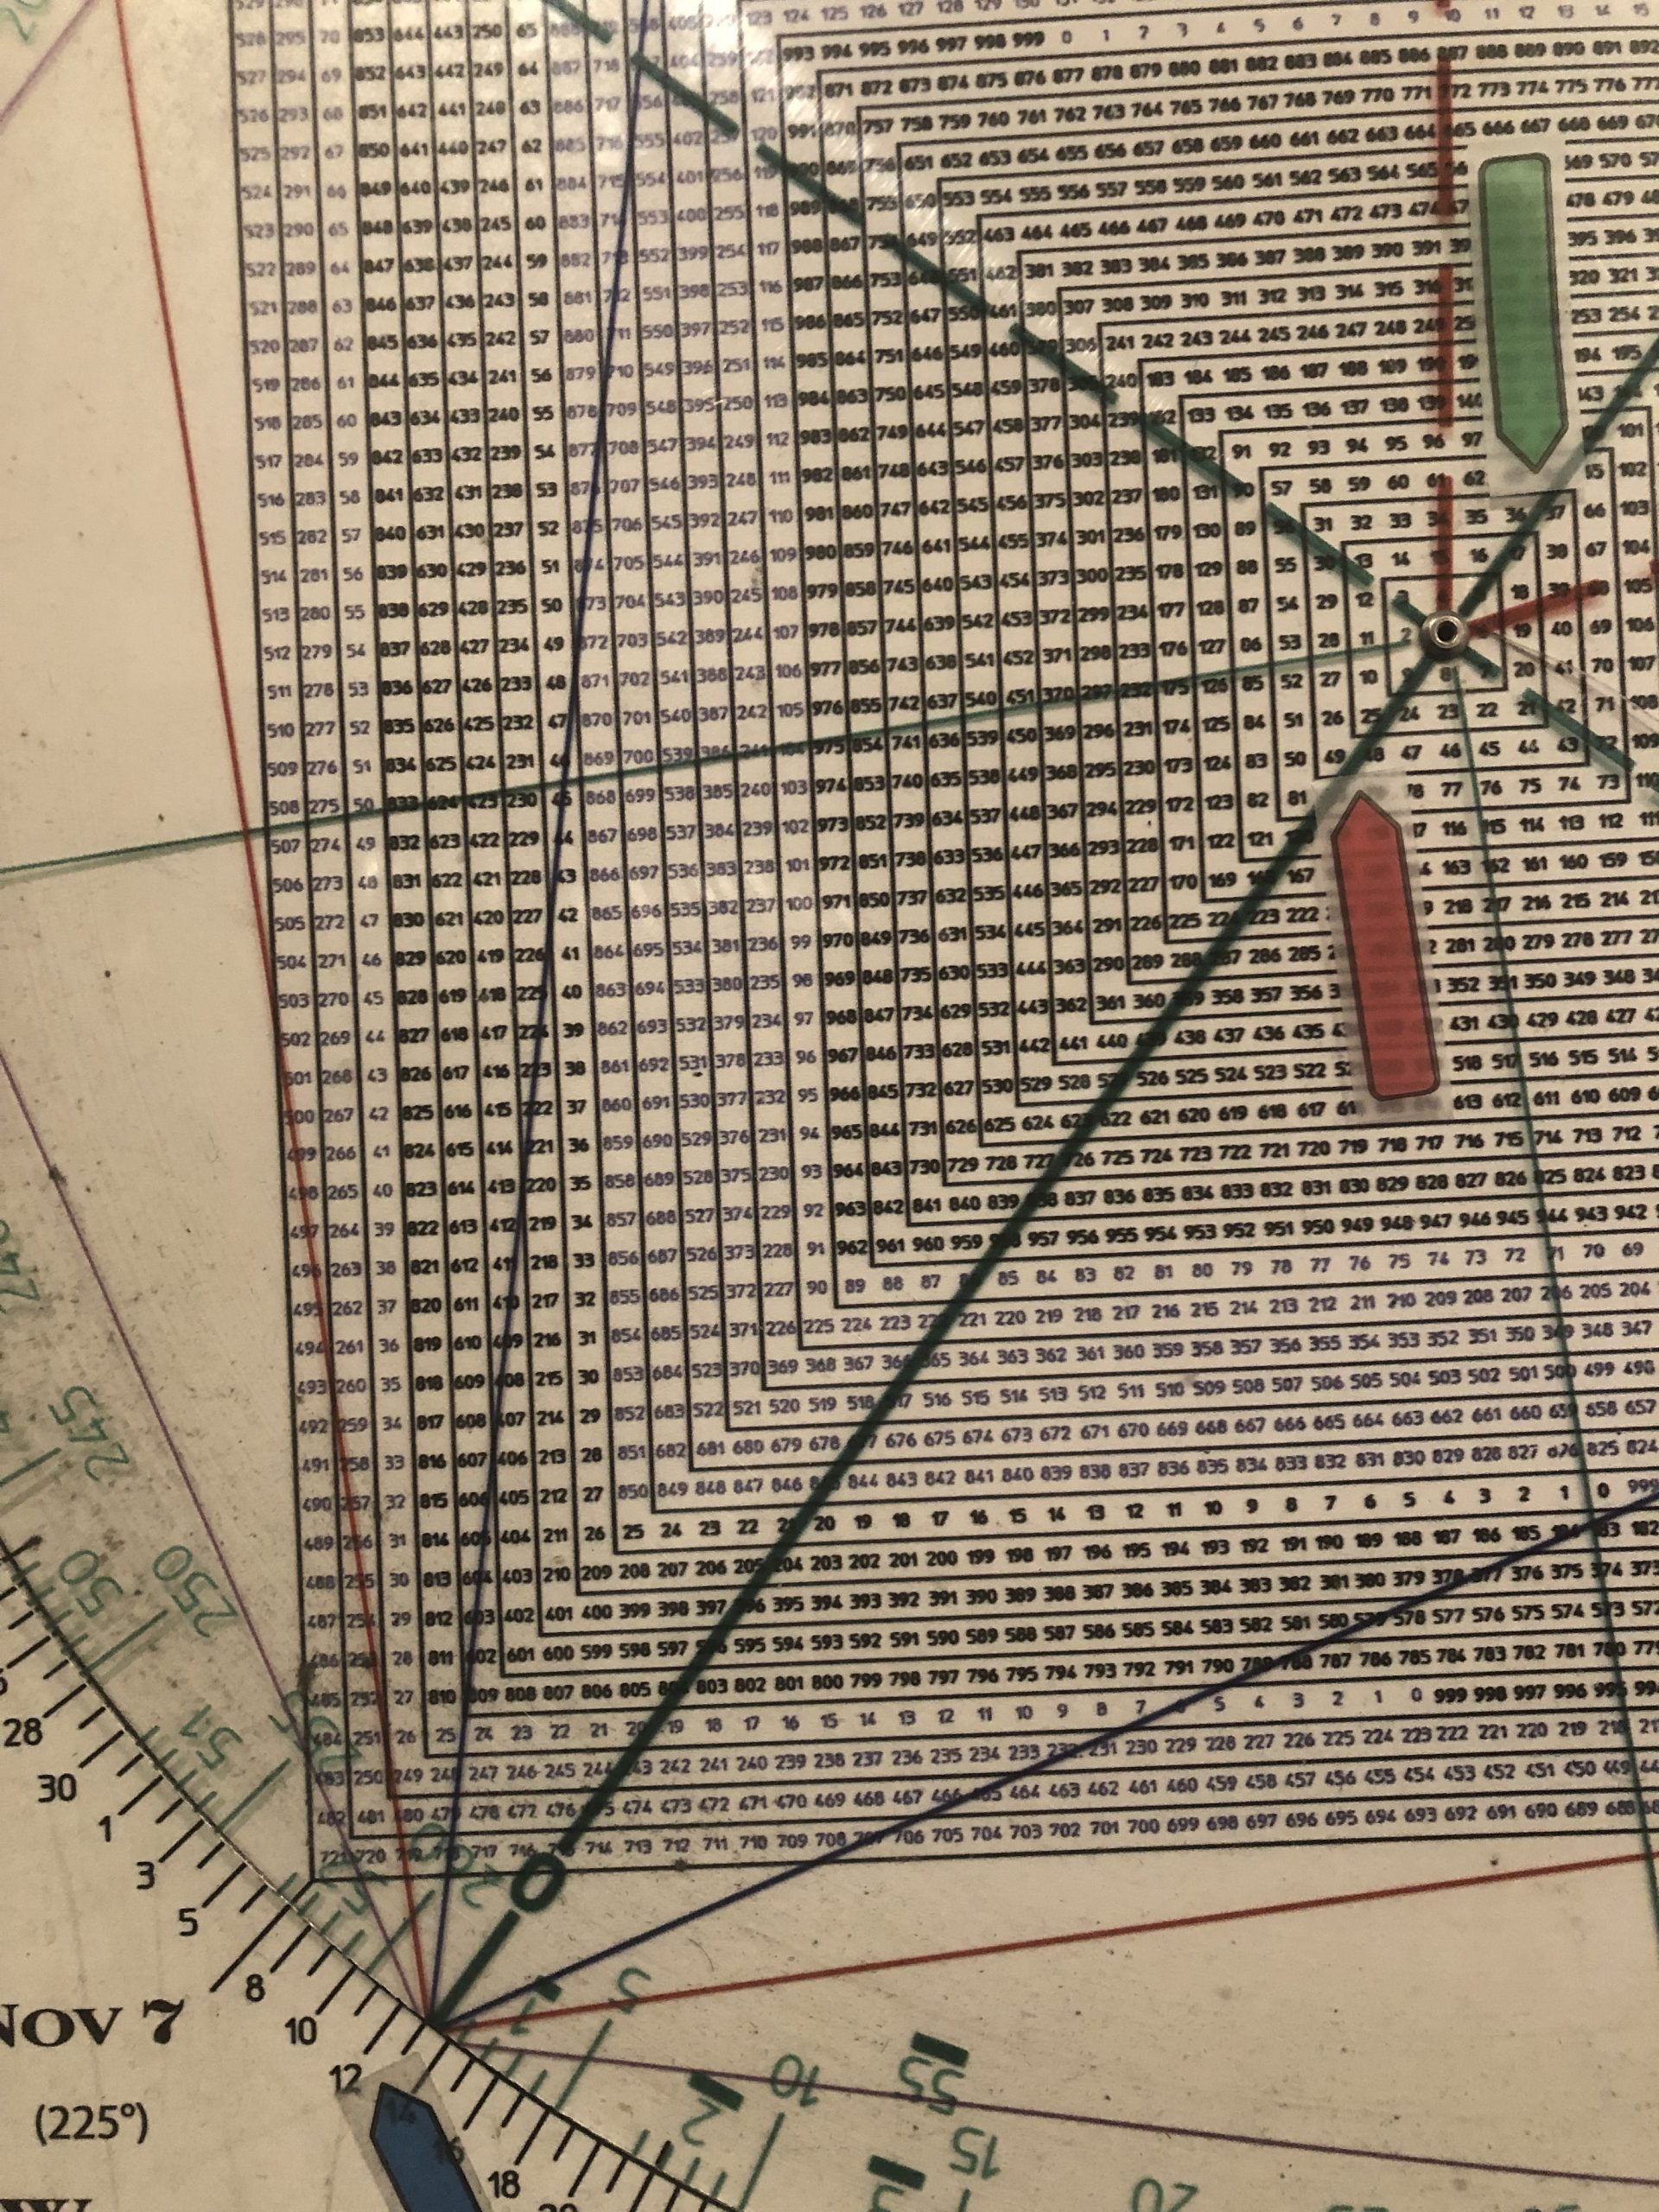
GDXJ struck a swing high on November 12 (blue) at 48.25.
48.25 (green) aligns/vibrates with November 12 for a Time/Price square-out.
180 degrees opposite is 36.50, the low on January 28.
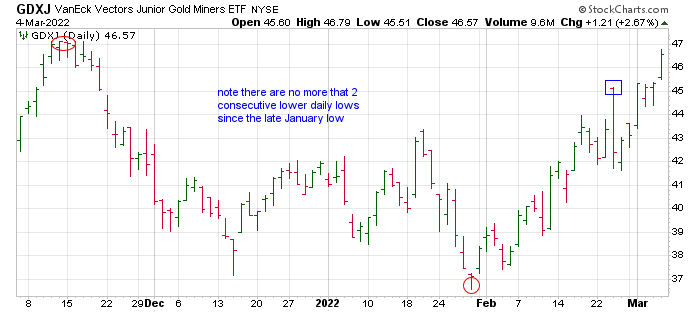
Last week, we told members that if GDXJ (and GLD along with several other miners such as WPM and PAAS) offset the large range downside reversal from Feb 24, it would explode. This was a Reversal of a Reversal, or what I call a Keyser Soze.
Fast moves come from false moves.
The GDXJ 2/24 high was 45.16.
On Friday, GDXJ closed at 46.57 with a near term objective of 49-50.
Likewise, two weeks ago we stated that if GLD cleared and sustained 183, it opened the door for a fast rally to as high as 211.
Speculation is observation, pure and experiential. Thinking isn’t necessary and often just gets in the way.
Speculation is anticipation of the anticipators.
The remarkable Sq of 9 Wheel breathes life into both maxims, giving glimpses of the future.
2022 is going to be unlike 2021 in that clusters of cycles forecast intense swings such as we’ve seen in the first few months to continue throughout the entire year.
This is a tremendous opportunity for the Hit & Run trader versus the Buy & Hold trader.
It is a dangerous time for those without timing tools and the pinpoint price projections given by the Square of 9.
Check out our Hit & Run Report and Hit & Run private Twitter feed, providing long and short day trades and swing trades since 1996.