VIX Explosion Confirmed: Here’s What’s Next
On November 29, Jeff Cooper said the VIX would explode, and it did:

And just yesterday, Jeff initiated a position in IWM December $162 puts. He just locked in a 29% gain on half the position — in 1 day!
He also went long TZA which is up 5%.
Click here to get his next trade!
********************
My December 3 date hit and the market broke (1 day early).
I have been looking for a turn in the markets in early December because of 3 factors,.
1) 180 days/degrees from the Dec 3, 2018 pivot was the big June 3, 2019 low. That low (2729) perpetuated a 425 point jagged march to last Wednesday’s all-time high.
Another 180 days/degrees from the June 3 low is December 3.
2) At the same time last in last Wednesday’s report we wrote:
“The SPX struck a magic Gann level yesterday. This is 56 squared, which is 3136. Allow me to explain.
You see, W.D. Gann was the first to recognize that panics often begin from around the 56th day from an important high or low. Two of the biggest examples are the 1929 crash which occurred around 56 days from high.
Ditto the 1987 crash.
The same has been true of blow-off tops culminating around 56 days from a pivot low.A good example is the final run into the October 11, 2007 top that started from an August 16 pivot low.”
We went on to give several other examples.
3) Additionally, we flagged the remarkable synchronicity last Wednesday was the 56th calendar day from the October 3, 2019 low.
In league with this time and price synergy, a VIX Volatility Explosion signal was on the table and we did a video walking through the setup.
On Monday, the Volatility Index, the VIX, surged 21% intraday. On a closing basis. it was the largest single day percentage rise in over three months.
Breadth closed with 788 advancers on the NYSE versus 2122 decliners.
Monday morning’s report showed the setup of what can happen when an item, in this case the DJIA, is stretched above its 200 day moving average.
One thing we know about price is that it is mean reverting.
On Monday, that mean reversion hit with authority.
Growth glamours hit an air pocket. My 4 Horsemen stumbled:
MDB tanked 11
COUP shed 5 points
OKTA sank 8
TTD plunged 36 points
A daily SPX below shows the nasty Trap Door setup:
1) A high tick close on Wednesday
2) Up open overnight on the futes despite Trump signing bill in support of Hong Kong protestors
3) Small green on Monday’s open
4) Plug gets pulled to start the new month
So where can the SPX go?
While the DJIA closed below its 20 day moving average on Monday, signaling the minimum potential for a 1000 point/one month decline, the SPX tested its 20 day yesterday.
That 3107 level where the 20 day resides is set to be snapped on a gap this morning.
90 degrees down from the 3154 high is 3098.
180 degrees down is 3042 — near the 50 day m.a.
270 degrees down is 2987 — near a 50% retrace of the rally.
360 degrees down is 2933 — near the 200 day m.a.
With 2993 being 90 degrees square the October 3 low, the implication is that the path of least resistance is toward the 2933 to 3000 region, as long as we get sustained follow through below the 20 day moving average.
Green arrow is October 3.
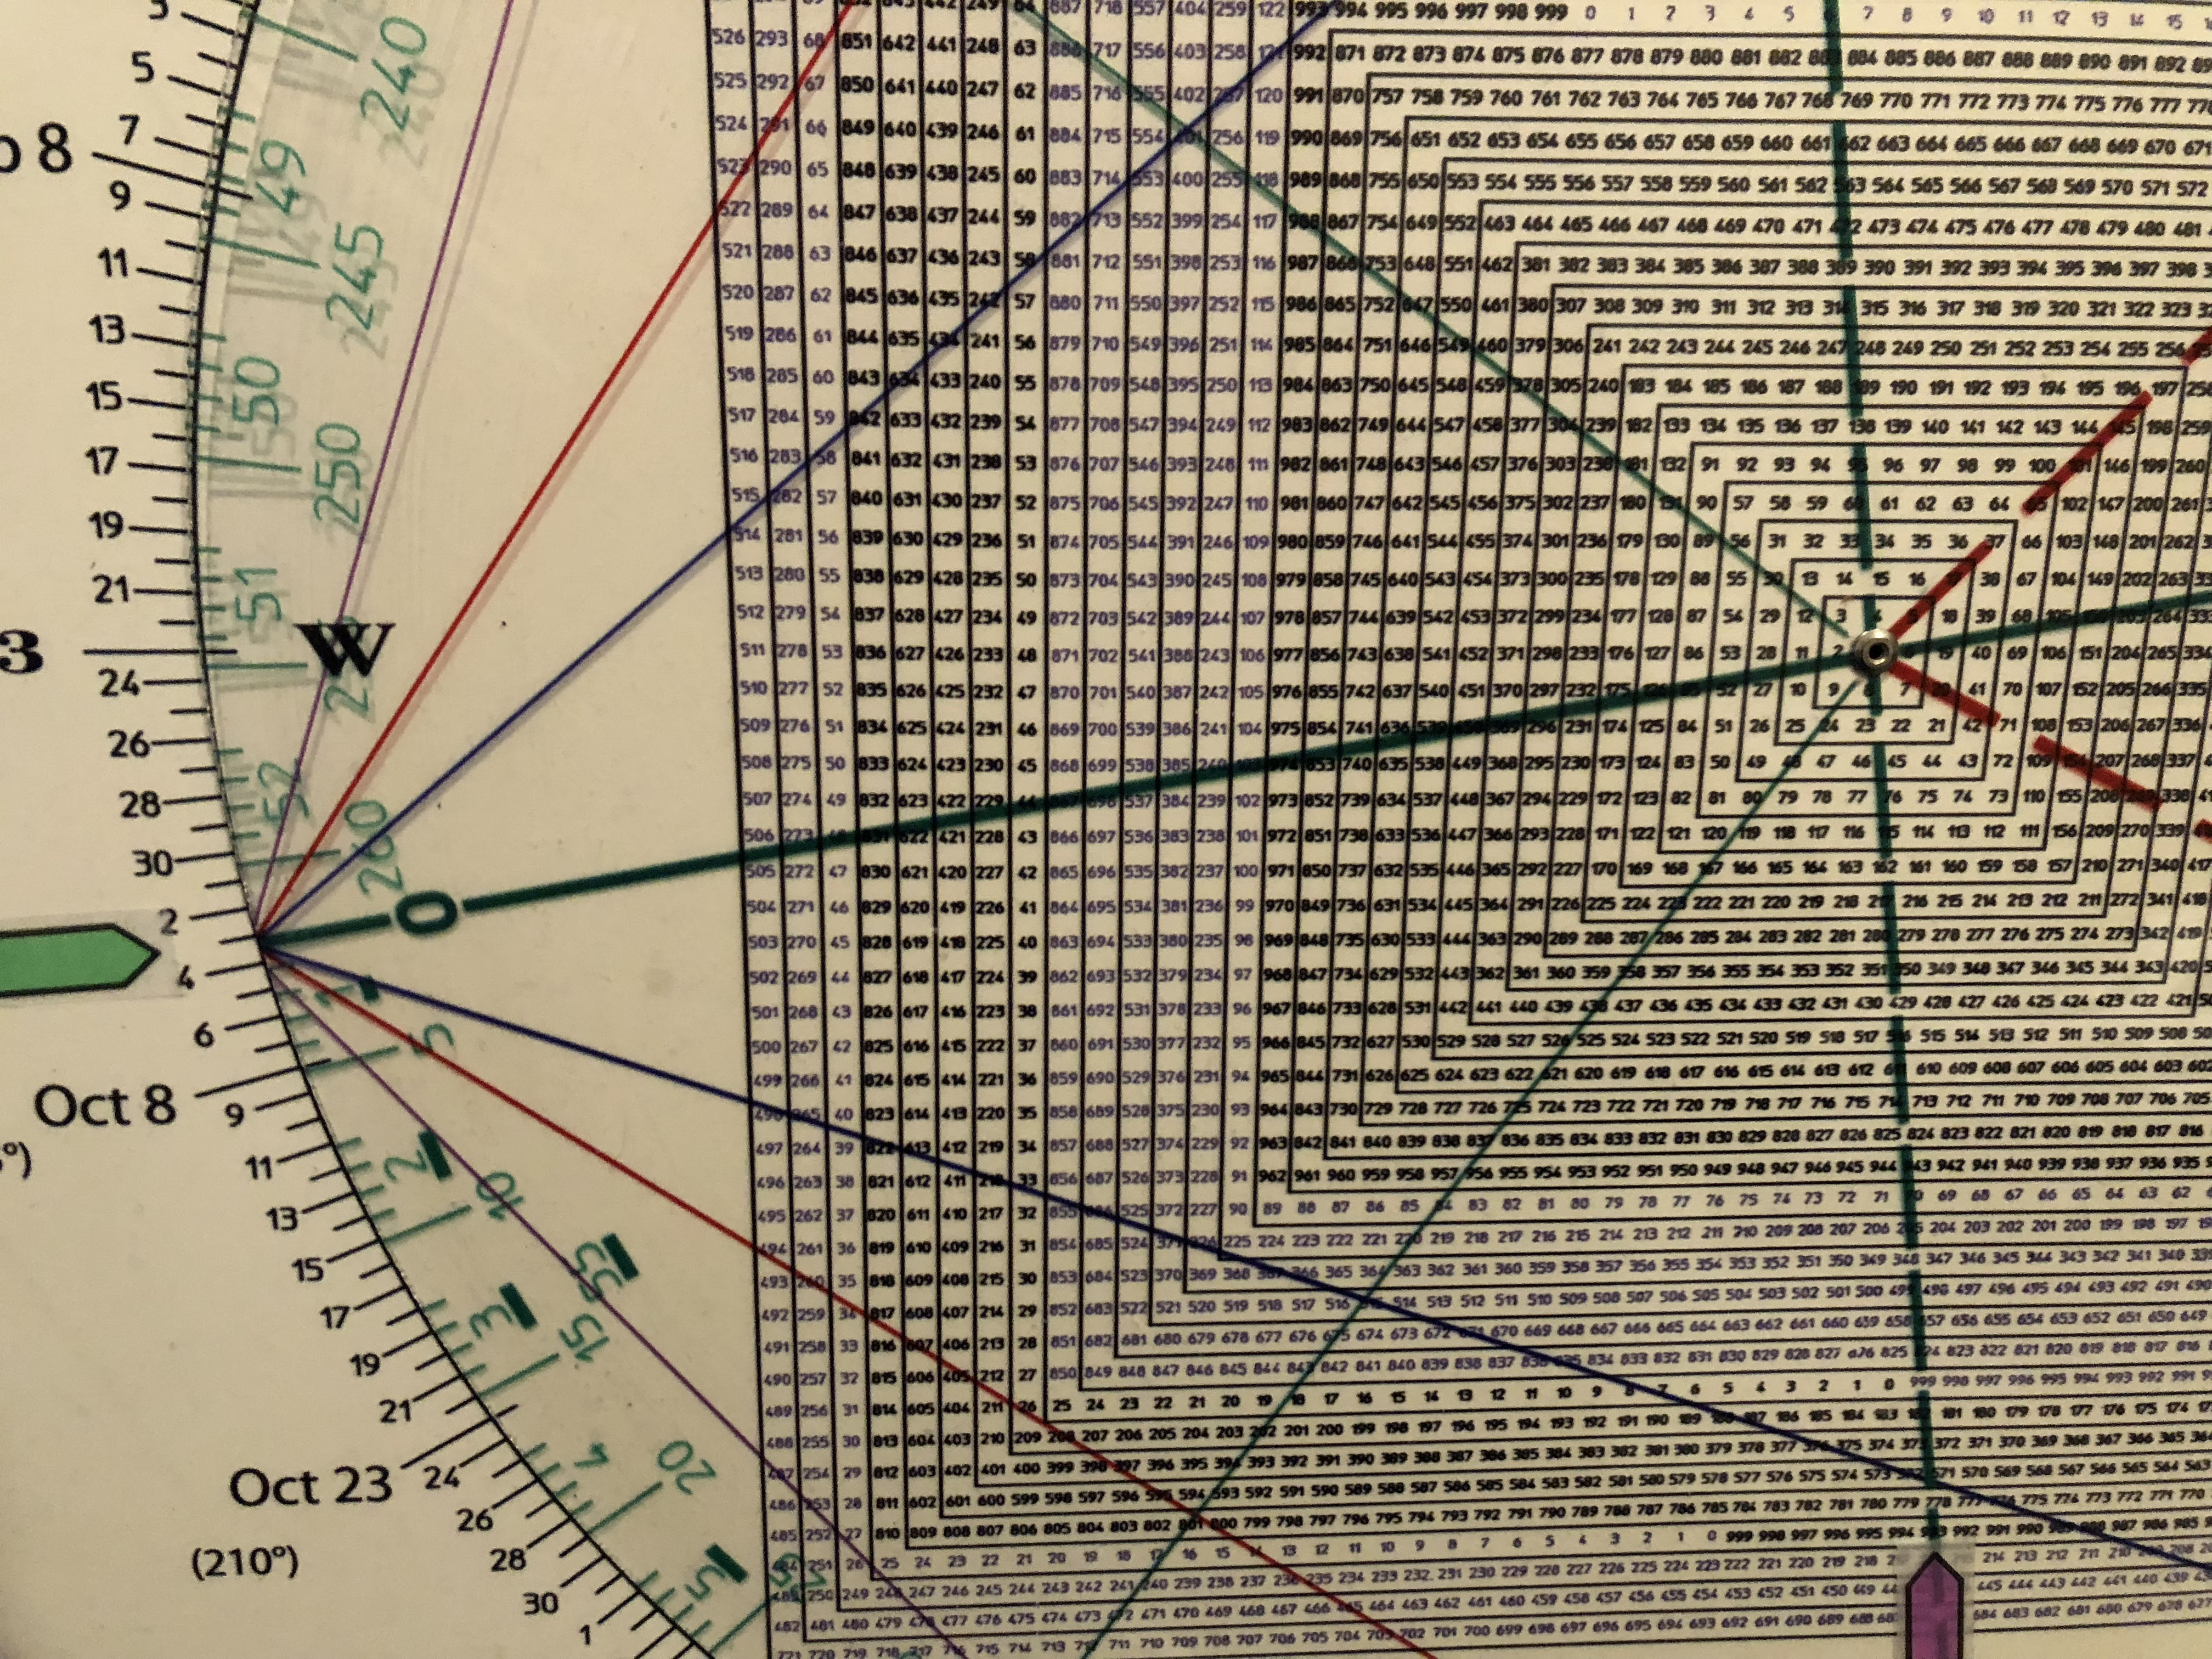
Purple arrow is 993 for 2993 (in the outer rung)
Notice the square out with the end of the year where the upthrust occurred in 2018.
Just when the vast majority of market participants were convinced of a continued run up into year end, it looks like Mr. Market staged an ambush.
Just when it looked like a mirror image of the decline from October 3, 2018 indicated an advance through year end, and that a repeat of 2018’s Christmas Massacre was off the table, unrealized gains are vulnerable.
Yesterday is a good example of air pockets resulting from profit taking when buyers have their wallets on their hip on the first day down.
Conclusion. Even in a bullish pullback, a 180 degree correction can play out. This is the 3042 region, which ties to the breakout point.
Even in a bull market, the normal expectation is for the breakout point to be backtested.
However, breakage below 3140ish suggests a larger top is in.
Moreover, the action we are seeing this week is indicative that the back of the runaway move is broken, regardless of whether the recent runaway train turns into a sleigh ride from hell or not.
Position in IWM puts, UVXY, UVXY calls