
The 2 Ugliest Charts in the World
What a week! Alphabet (GOOGL) failed on earnings and there's no peace in the Middle East. So let's go over:
- The 2 ugliest charts in the world
- Why it's hard to be an AI hyperscaler right now
- Why Nvidia may be a value trap
- Where sentiment sits
Let's go.
Ugliest Chart in the World #1
SpaceX (SPCX) was hot for 4 days.
Now it's been cut in half.
We identified $150 as an obvious line in the sand.
And SpaceX just cut through it like a knife through butter:
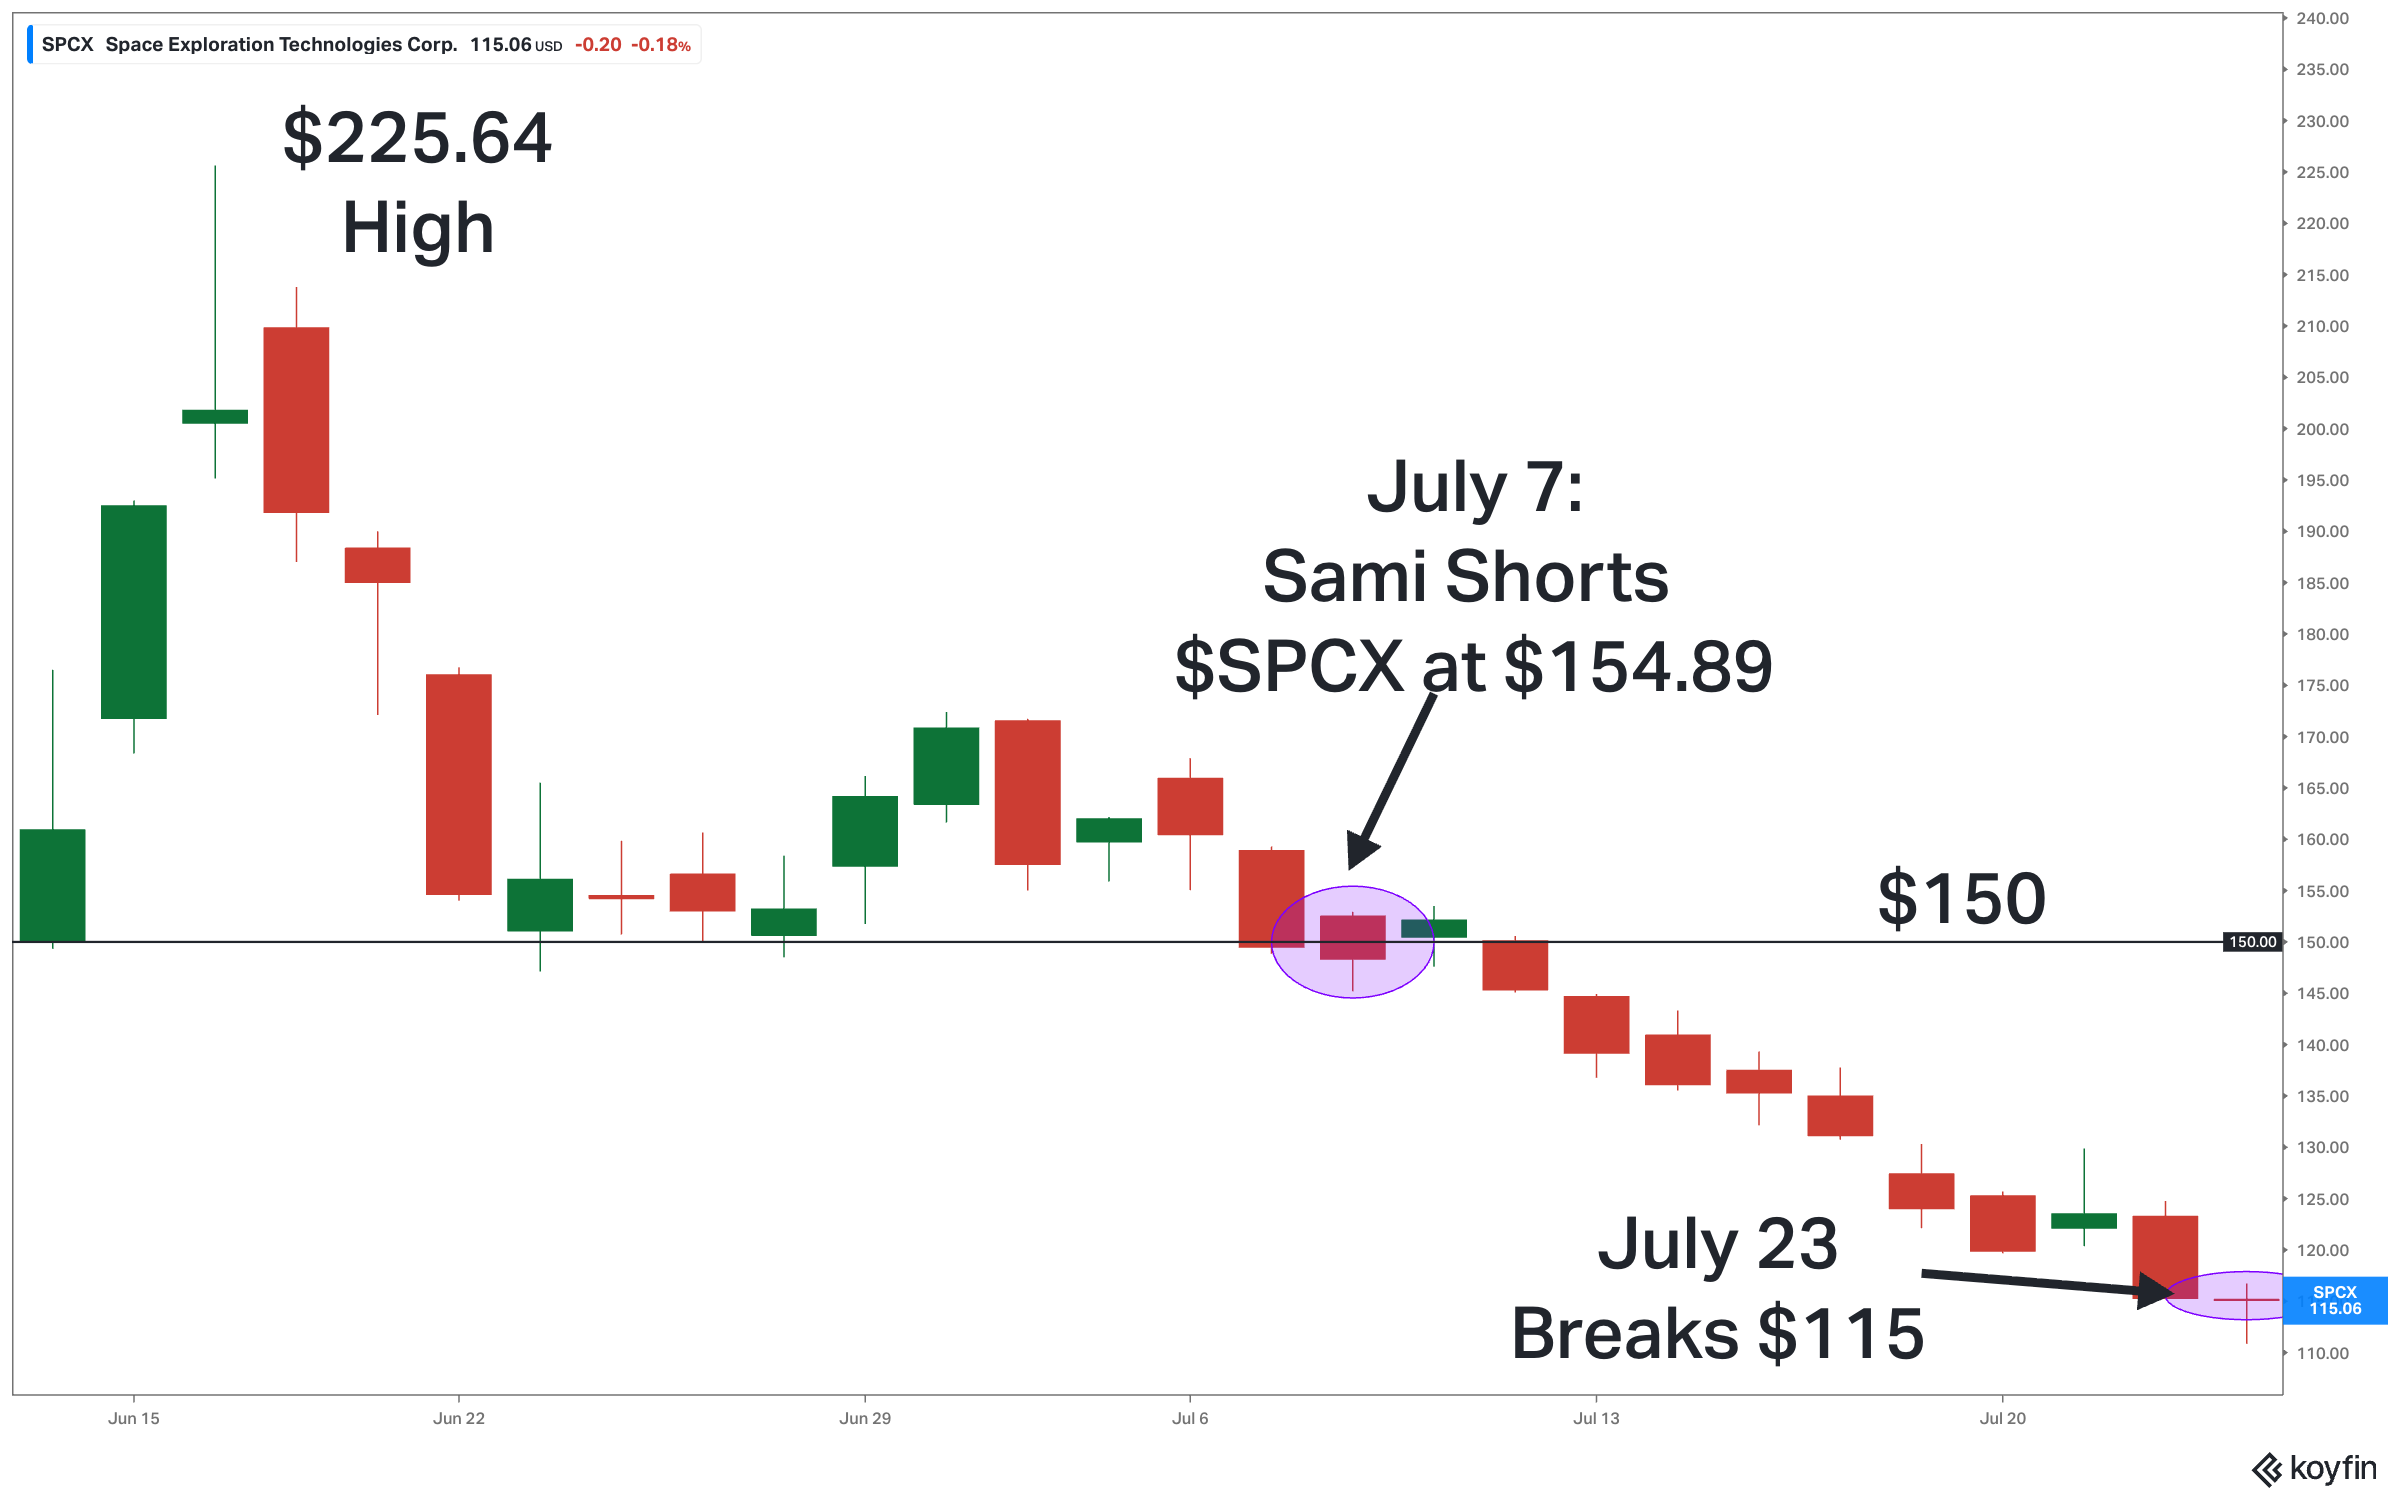
And let's give credit to Sami Abusaad!
He got short at $154.89 and has been riding it down the whole way.
So why is this stock getting dumped?
Because the more the stock drops, the more attention is paid to the danger on the horizon (insider lockup expirations).
That's created a race to the exits.
Meanwhile, Wall Street banks (many of whom earned paid big fat IPO underwriting fees from SpaceX) love the stock.
According to Koyfin, the average analyst target price is $236.71:
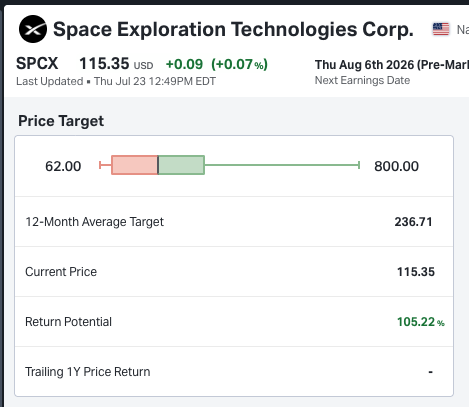
So they think SpaceX will double.
Do you?
Now let's talk about its twin…
Ugliest Chart in the World #2
This is Oracle (ORCL) over the past year.
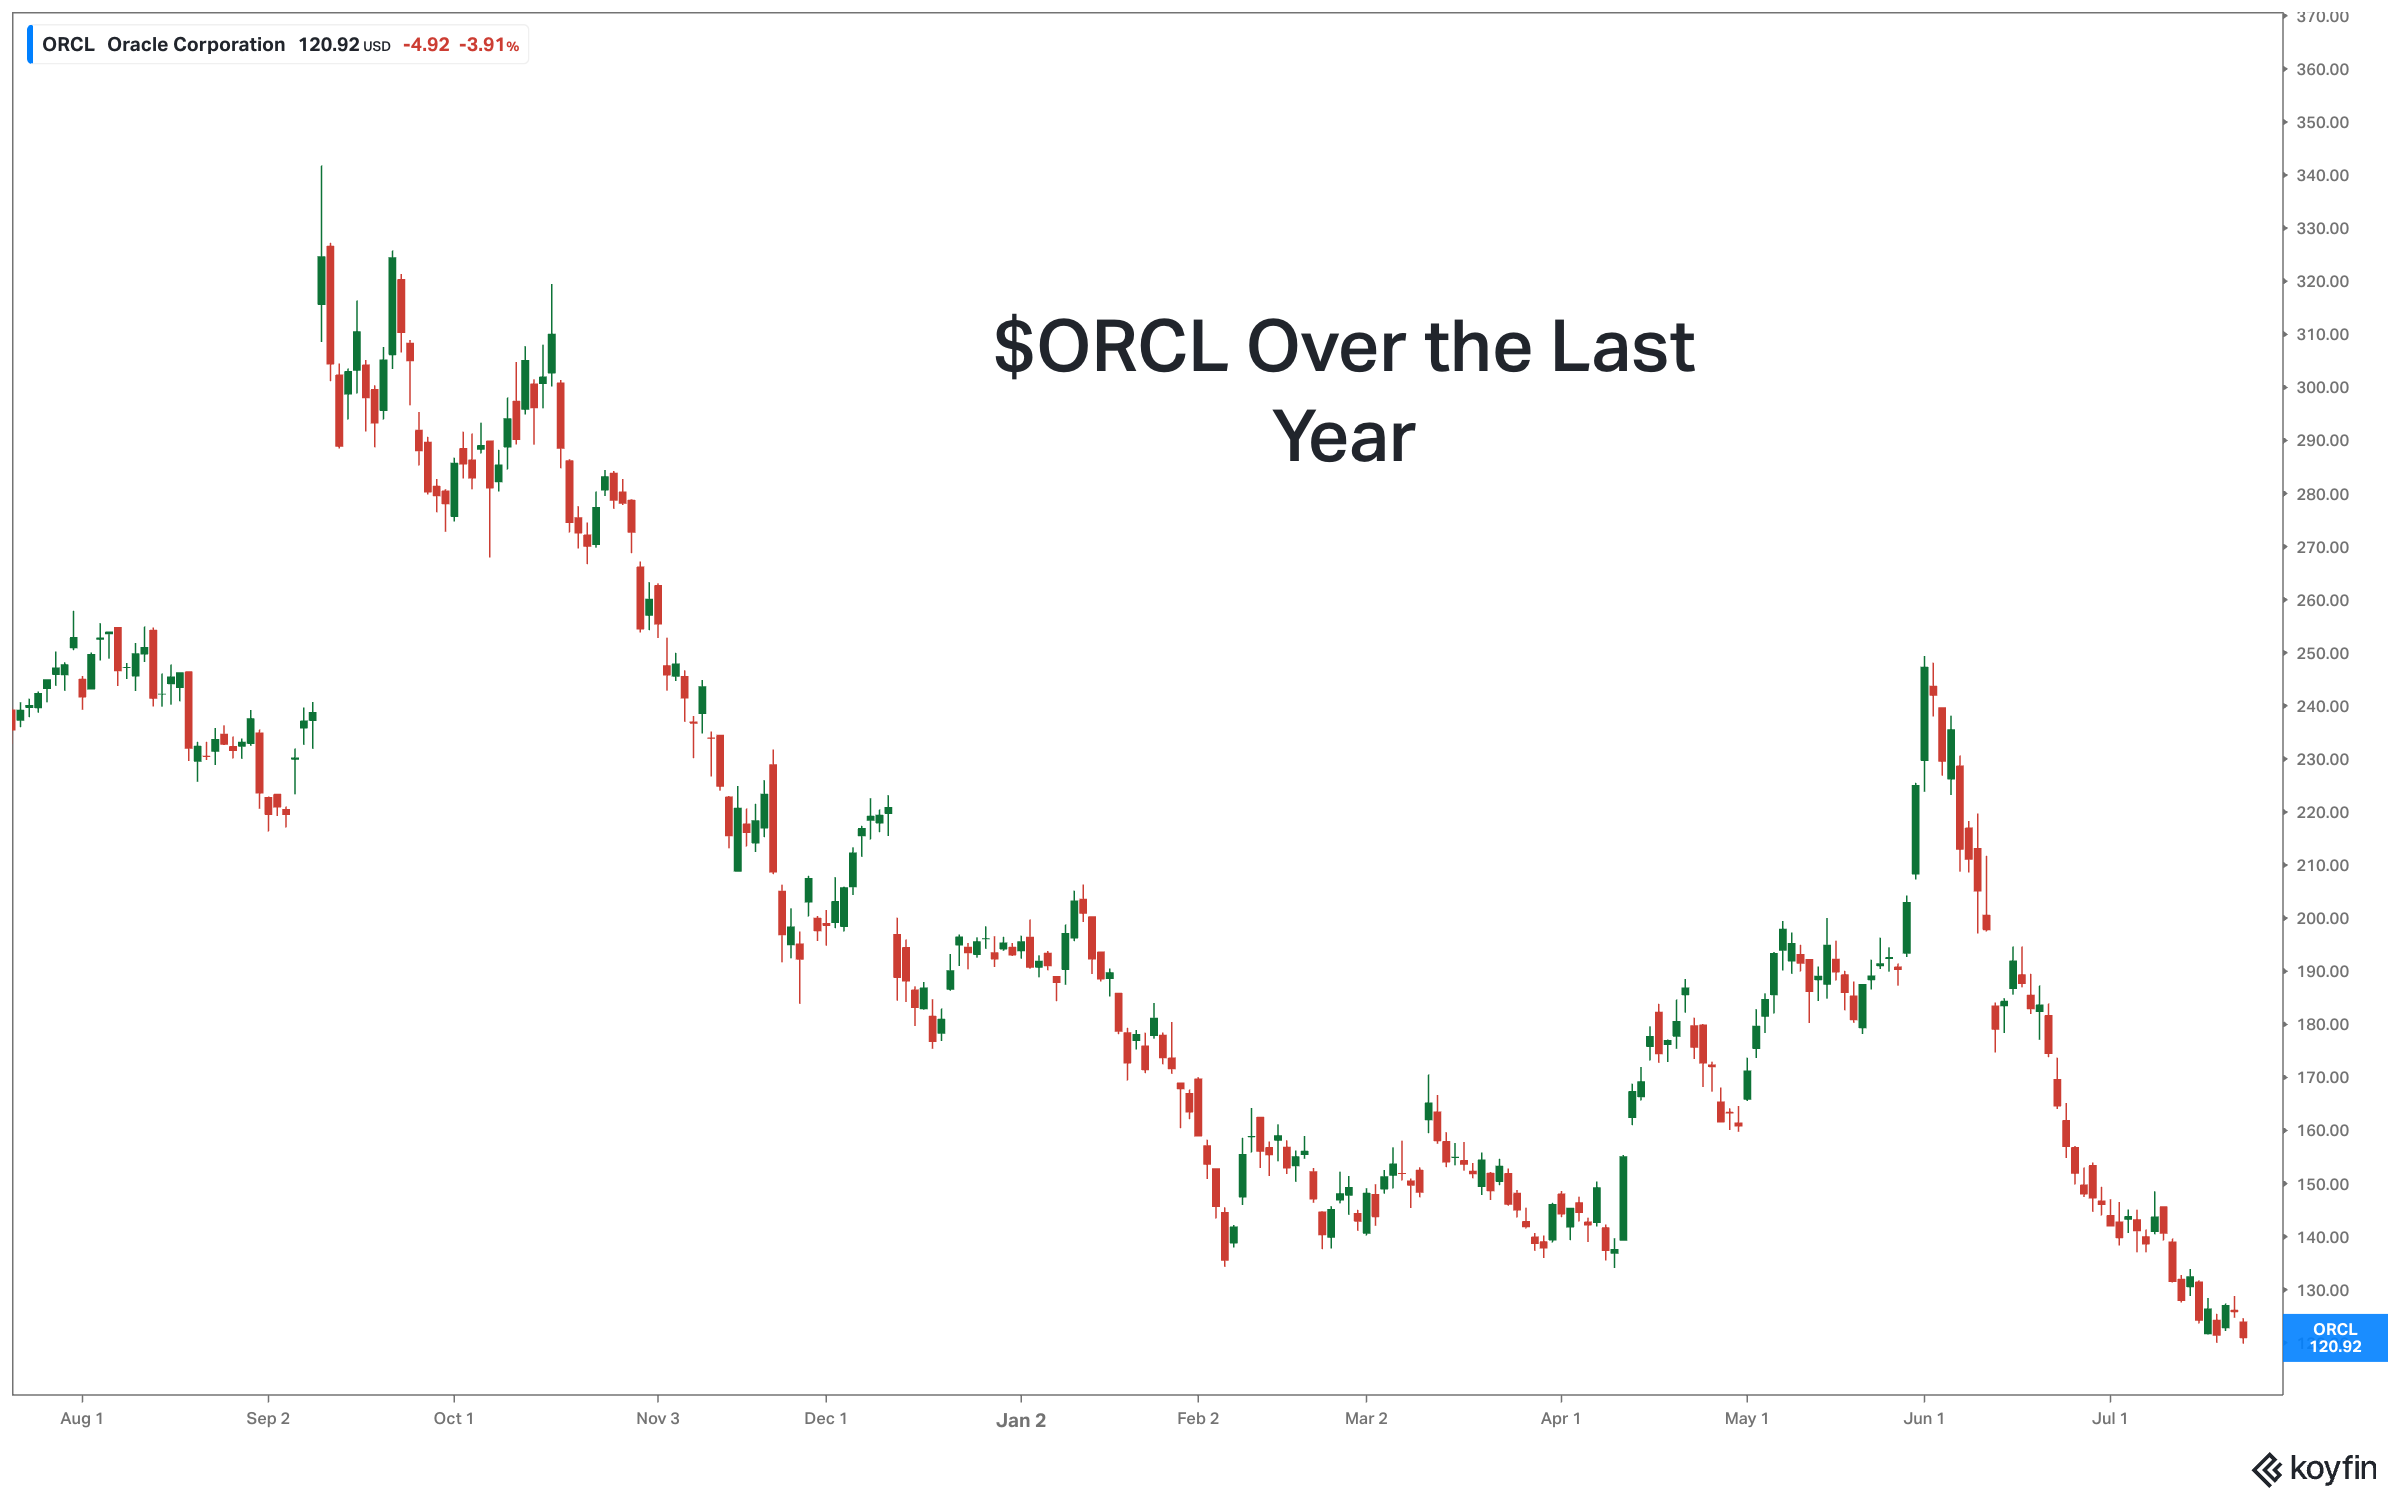
Oracle has a major problem.
It's a hyperscaler with potential credit problems.
While other AI stocks like Microsoft has heaps of recurring revenue and free cash flow to reinvest in capital expenditures, Oracle does not.
Just so you understand the difference in scale here, Microsoft generated almost $73 billion in free cash flow over the past 12 months.
Oracle (ORCL) had NEGATIVE free cash flow of almost $24 billion.
So it has to borrow tons of debt to power its AI dreams.
Maybe too much.
It's Hard Out Here for a Hyperscaler
The AI market remains split between “haves” and “have nots.”
The AI hyperscalers are most certainly have-nots in 2026, given these performance numbers:
- Alphabet (GOOGL): +2.8%
- Amazon (AMZN): +2.3%
- Meta (META): -7.9%
- Microsoft (MSFT): -19%
- Oracle (ORCL): -36%
Meanwhile, the VanEck Semiconductor ETF (SMH) is up a whopping 61%.

This makes sense because the hyperscaler buildout is a wholesale transfer of cash flow to the likes of Nvidia (NVDA), AMD (AMD), ASML (ASML), Micron (MU), SanDisk (SNDK), etc.
Think of it this way.
Google sucks up money selling ads.
Then that money goes straight to hardware and chips from the likes of Nvidia, AMD, Micron, Dell, etc.
Which flows down to networking gear, semiconductor equipment, etc.
At some point the trend reverses, but for now – hardware looks like easy money.
Especially when we have Alphabet raising its capex forecast. And Meta, Microsoft, and Amazon might do the same when they report earnings this week.
Is Nvidia a Value Trap?
Many traders and investors are zeroing in on Nvidia's (NVDA) valuation.
The stock is now trading at 21x forward earnings, which looks cheap for the flagship AI chip name:
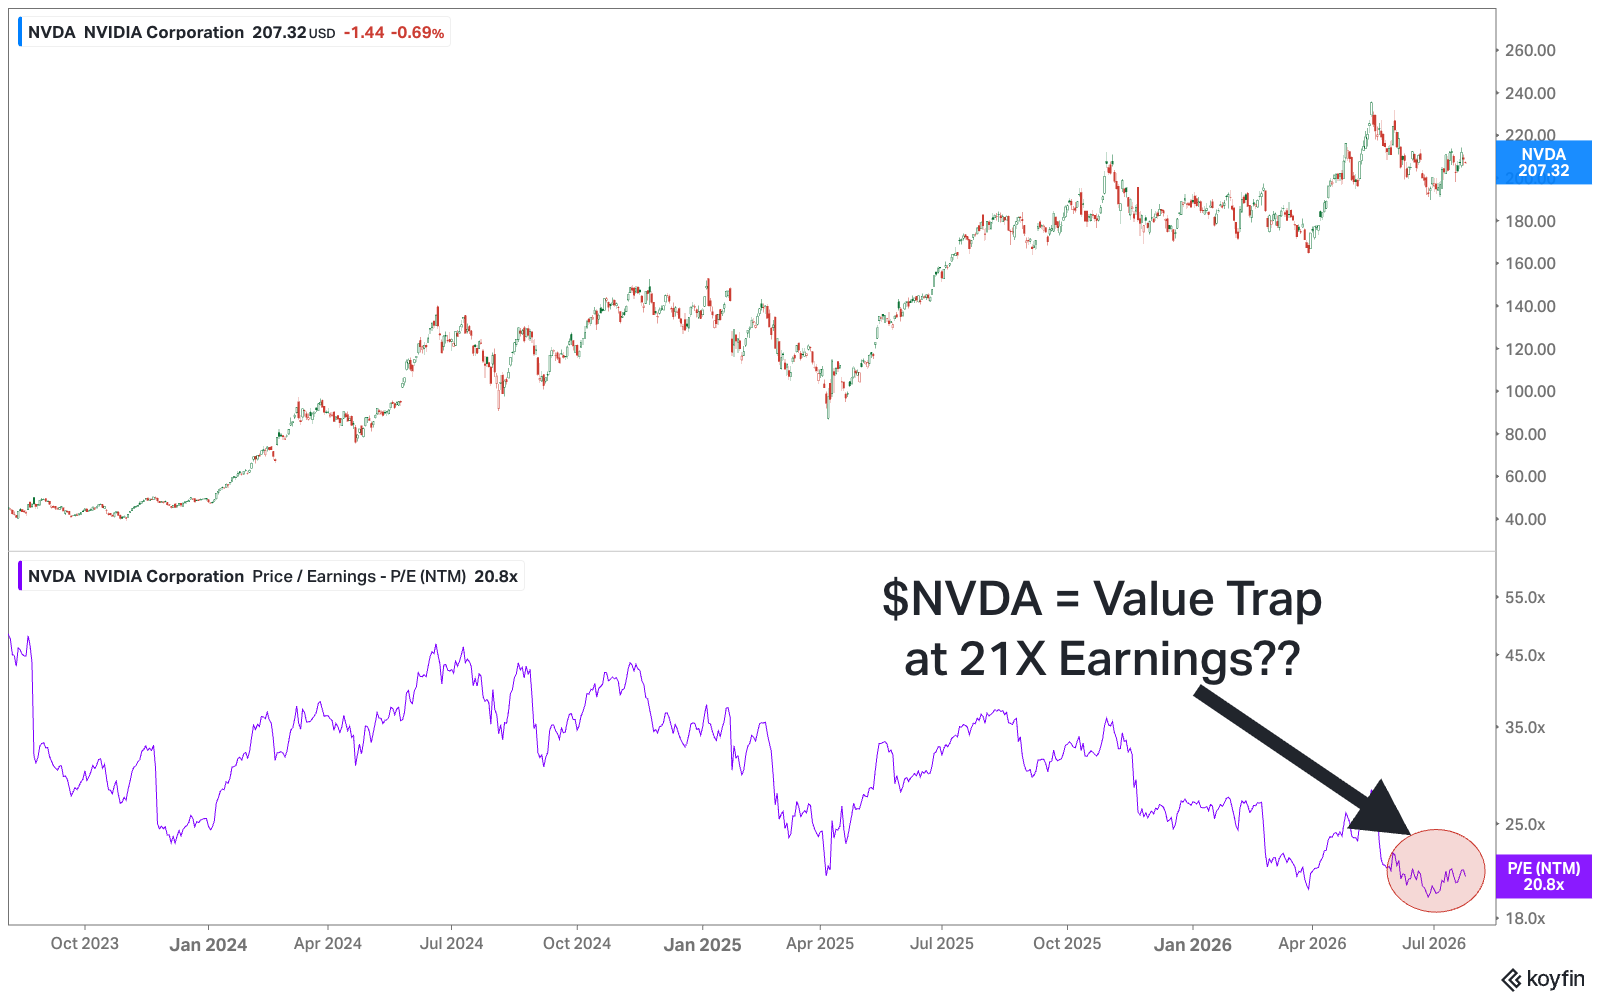
But I wonder if Nvidia is a value trap.
As in, it looks cheap but goes nowhere.
I see Nvidia's biggest challenge as a lack of sex appeal relative to other places within the AI landscape.
Right now, the market is excited about the memory and storage names, because that's where the biggest supply-demand imbalance is.
On Thursday's earnings call, Intel (INTC) CEO Lip-Bu Tan said “…memory has become the big supply constraint challenge.”
Yes, Nvidia is most likely still supply-constrained.
Just not at the level of a Micron (MU) or SanDisk (SNDK).
But we'll know for sure this coming week.
If we see Meta, Microsoft, and Amazon signal higher capex spending and Nvidia does nothing, then maybe the thrill really is gone.
We'll see.
In the meantime, I recommend watching this interview with Cerebras (CBRS) CEO Andrew Feldman, who shares some interesting points about the AI chip universe. He discusses why Nvidia's CUDA platform may be losing its competitive moat, though you should obviously take that with a massive grain of salt:
Investors Are Bearish… for Now
The AAII Sentiment Survey shows that just 29.6% of investors are bullish.

This is well below the 37.5% long-term average.
And it's a massive decline from last week's 44.9% reading (above average bullishness).
So are investors bearish?
Kind of.
These sentiment surveys have been topsy-turvy all year, so we never get any sustained bullishness or bearishness.
That reduces the predictive power of these numbers, which wasn't all that great to begin with (outside of real extremes).
Meanwhile, the CNN Fear & Greed Index is at 41, which is slightly fearful.

Add it up and it looks like investors are far from euphoric.
But they're not down in the dumps either.

5 Days Free in a $7,000 Trading Room
Trade alongside David Prince live, Oct 26–30