
Bottom-Up Roadmap for Stocks Over the Next 6-9 Months
Every trader, in order to be successful, must have some systematic process for identifying, entering, and exiting trades. Each trader’s specific process is going to be unique to their own experiences and beliefs. My own process has been developed over almost 20 years in markets, first as a hobby while I was a telephone salesman in a cubicle for a big tech company, next as a trader on a prop desk, then as a professional equity portfolio manager for a small RIA, and lastly as a refinement when I completed the CFA exam.
Because I operated in both the trading and investing worlds, my process is a combined approach that incorporates both fundamentals and technicals. Similarly, I combine both a top-down and bottom-up approach to asset, sector, and individual stock selection. In previous posts I’ve explained my top-down reasoning why my view continues to be that we are in the contraction phase of the business cycle. This week I’ll present what my bottom-up analysis reveals to us as we try to anticipate price movements in the stock market over the next few quarters into 2027.
As opposed to a top-down approach which starts from trends and works down more granularly to individual stocks, a bottom-up approach starts with individual stocks and works up to extrapolate larger themes. A bottom-up approach is a wonderful antidote for the narrative heavy environment in which we currently find ourselves. An analysis of individual stocks often reveals that a popular narrative is not gaining traction in the stocks that should be strong if the narrative were true. As a naturally born contrarian, I’m skeptical of any popularly accepted narrative, and I rely heavily on scrolling through thousands of charts a week to verify that the prevailing narrative is being validated by price.
Thankfully, we don’t have to go over thousands of stocks to get a workable roadmap for how to deal with this market into 4Q 2026 and early 2027. A smaller sample of stocks is enough so I’ll keep my bottom-up analysis contained to a manageable list of sectors and stocks in this week’s post.
I’ve taken the leading stocks in the sectors that are most crucial to the US business cycle at the moment: semi-conductors, transports, industrials, utilities, chemicals, and basic materials. The industrial sector contains seven sub industry groups: aerospace, automotive, construction, distribution, electrical equipment, building products, and machinery.
I’m focusing on just the leading stocks in these sectors because I think they are a full representation of the most influential narrative in the stock market today: the AI buildout. I want to analyze the individual stocks in these sectors to discover any clues they might tell us about the future path of the AI buildout, which will dictate the path of the US business cycle, which will ultimately influence stock prices. We start at the bottom and work our way up to get to our goal: anticipating the movement of stock prices.
The sectors and stocks we’ll analyze seem like a lot of material to digest, but I’ve distilled the information down to a basic form that is easy to absorb in a short amount of time. It’s a useful exercise for anyone risking their capital in the stock market. These are the stocks we’ll be analyzing in each sector; semi-conductor: ADI, AVGO, MRVL, MU, QCOM, TSM, and TXN; transports: UNP, NSC, CSX, JBHT, ODFL, DAL, and UAL; industrials: aerospace: GE, RTX, BA, LMT, GD, HWM, TDG, LHX, and NOC; auto parts: MGA, BWA, and MOD; construction: PWR and FIX; distribution: URI, GWW, and FAST; electrical equipment: ETN, VRT, and EMR; building products: TT and JCI; and machinery: CAT, DE, PH, ITW, CMI; utilities: SO, NEE, and DUK; chemicals: APD, DOW, LYB, SHW, ECL, PPG, and DD; and basic materials: BHP, RIO, FCX and NEM.
I’ll begin on the fundamental side and analyze the valuations and end with a video on the technical side to show what I think the price and volume structures are warning us about.
The only goal I have when analyzing fundamentals is to answer the question “do I want to own this stock?” That means I like to think as a business owner would if he was considering pouring all his family’s capital and his life’s energy into a business. I like to take the 15 year average of pretax income as a rough estimate of what the company would be able to earn on average over a business cycle, in other words, its earnings power. If the market cap of equity is 10 times the average earnings power, I know that stock is probably below fair value. If 10x is below fair value, 20 times the average 15 year earnings power is about the top of the limit. 20x means there’s very little room left for good price appreciation from an ownership perspective. Stocks that trade this high are for rentals only, not ownership, as they are mainly earnings growth stories that can experience temporary, but powerful price movement in either direction.
The market cap to earnings power ratio over this 15 year time frame is what I refer to as the PE15. I like to see lots of sectors with low PE15s because that means too few positive outcomes are priced in, and any good development will cause money to flow in. If enough sectors of the market have low PE15s, it means the market is attractive as a long term asset. Long term buyers are what create price trends that last. However, if the market is unattractive to long term money, I would not expect a new price trend higher to materialize in the next 6 to 9 months.
The PE15’s for each group of stocks by sector and my assessment of the potential for a proper trend higher are listed below, but if you want to jump to the conclusion without any of the detail, here it is: with a couple exceptions in mainly chemical commodities, natural resources, and small auto parts suppliers, stocks are far too expensive as an asset class to draw in the permanent type of capital that will create lasting trends. Stocks would have to see significant declines of 50% or more to be attractive as an asset class for ownership. That means almost every stock will have to be a short term rental on the long side if it fits your trading process.
Now for the details on how I arrived at that valuation assessment based on the PE15:
Semi-conductors: the PE15 average of the group is well over 100x with TXN the lowest at 44x and MRVL the highest at 977x. The sector is uninvestable at the moment. Because the valuations are so unreasonable, semi stocks are for short term rentals only.
Transports: The average is 28x. For cyclical stocks, this is a very expensive price to pay for highly volatile earnings. Removing the two trucking companies, the PE15 comes down to a more reasonable 23x, but that is a lot to pay for companies that will grow basically at the level of GDP in the US. This group is also relegated to short term rentals only. No serious investor looking to allocate his family’s irreplaceable capital would consider these stocks as worth owning at these prices.
Industrials; aerospace/ defense: This is not a homogenous group. BA and HWM are well over 100x, and only LMT, GD, and NOC are 20x. The rest are well over 20x. Since none are under 20x, the group is for rentals only.
Industrials; auto parts: This one is more interesting from an ownership perspective. Autos are a huge part of the economy and represent the state of the consumer and job market. MGA is the largest auto parts supplier and it trades at a very respectable 9x while BWA trades at a more expensive 15x. MOD is off the charts at 141x, but its business has gone through a transformation recently so it’s not a fair comparison. This is one sector that at least has a possibility, however small, of a price trend higher.
Industrials; construction: this is one group that is at the heart of the datacenter buildout, and their PE15s show it. Both are over 100x. There is so much positive expectations priced into these stocks that they are entirely story stocks now, and thus, short term rental material only. I’d expect only temporary price movements in these two names. My guess is that even the greatest news can only bring these to the top of a range but not start a new trend.
Industrials; distributors: all three trade at over 40x. That’s too expensive to rely on a trend to develop.
Industrials; electrical equipment: All 3 are well over 30x. Rentals only.
Industrials; building products: Both are over 50x.
Industrials; machinery: CAT sits at 54x because of the AI buildout enthusiasm, while DE stands at a still expensive, but only less so, 33x. I wouldn’t feel comfortable betting on a lasting trend taking hold.
Utilities: SO and DUK are reasonable at about 26x, but NEE, due to its different operating model, runs at a much higher 41x. Even the boring utilities are unattractive to owners looking for a place to allocate long term capital.
Chemicals: There are some interesting cases here. While the average for the whole group is 23x, that is skewed heavily by the expensive specialty chemicals like SHW, ECL, and APD. The commodity chemicals like DOW and LYB are under 10x, with LYB the cheapest of any at 5x. This is because China is dumping commodity chemicals on the global market. Also, these companies’ petrochemical feedstock inputs are soaring in price. PPG is not expensive at 16x. DD is only at 7x, but it’s gone through so many changes in structure that it’s not a reliable estimate. Overall, the chemical group is too expensive to trend, even if some of the stock inside the group are cheap. Those ones may be considered for ownership as any good news in trade relations with China that makes progress in resolving the over supply could send the stocks trending higher. Additionally, any real construction boom in the US would see these stocks rampage higher. The fact that they are not participating is a reason to be at least somewhat skeptical about the AI buildout narrative.
Basic Materials: BHP and RIO are on the cheap side at only 14x, so we could see trends develop here. FCX is at 34x so I’m doubtful of any trend development in this name. NEM is at 75x so this one is range bound at best.
In all, I just can’t get bullish on these AI buildout adjacent stocks as they are far too expensive for a sustained trend higher driven by patient money. We’re already seeing the AI companies demand the government regulate them to slow down their progress. If implemented, that will have the beneficial effect of decreasing their expenditures and improving their cash flow metrics as they try to get IPOs out and bought up by passive indexing so insiders can sell. I think the two AI companies want this regulation excuse to stop the spending so they don’t have to do another capital raise until the IPO. If they get what they want, we could see a big slowdown in economic activity that will make the contraction phase obvious.
In addition to the bizarre request by the AI companies for increased regulation, the stock charts are also hinting that the buildout spend is at risk of ending. The video below covers what I view as subtle warnings from the charts that the spending is at risk of an abrupt end. The stocks covered represent the largest market cap stocks in each sector, so they will have more influence on market averages.
Individual stock charts by sector video:
As you can see from the video, I think the stock charts are warning us that there’s a lot of risk in these markets. I’m also very concerned about the possibility of a 1987 type of stock crash, as the market snuck in an initial break of the Dow Jones Industrial Average in the last trading day of August. If you’ll recall, I’ve been on the lookout for an initial break in August after a summer rally, a failure to get back above that initial break, then an October crash.
Here’s a chart of the DJIA highlighting the break on Aug 31:
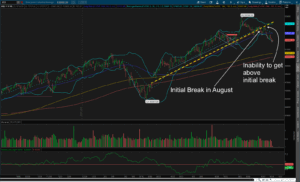
The situation seems to be aligning in that direction. The catalyst for the 1929 crash was a rate hike by the Bank of England, and the catalyst for the 1987 crash was a hike by the Bundesbank in Germany. I think a crash in 2026 would have to come from a Bank of Japan rate hike catalyst. As always, I’m a fair weather fan. So if the DJIA rallies above $53,700, I’ll toss my bearish notions in the dump quicker than the blink of an eye.
I’m a position trader, so I will generally have most of my portfolio in a theme and try to ride it while my account pumps to new highs. At the moment, my largest position, by far, is cash at about 75%, and my account is most certainly not pumping to new highs by being in risk off. I’ve been trying to get into TLT for a bullish flattening of the yield curve, but we are in the middle of a bearish flattening with the short end rising faster than the long end. Since my only big idea isn’t working, I’m waiting until I get a price signal I recognize. I’m also waiting for $3,825 on gold before adding to my core position. Basically, I’m doing a lot of waiting.
There are only a couple things that would force me off the sidelines and into a more bullish stance. In addition to rising above the $53,700 level on the DJIA, one of those would be an increase in bank C&I loan growth for a second quarter in a row that takes out the 2020 highs. That would start to look more like a repeat of the 1970’s inflationary period, which would require picking small cap stocks that can adapt to the changing business environment better than large caps. So I’ll keep an eye out for that while I’m waiting for setups to appear.
This is the hard part of any process: letting it tell you when you should enter. Until I get the setups I want to see, I must stick with my process no matter how long I have to wait, remain in a positive mindset so I can see the opportunities when the eventually develop, and react instantly when they do. This is the only way I know how to grow my capital. It’s a process that’s unique to my own experience, and it’s worked for me so far. I plan to remain patient and let the market tell me when it’s right to put my irreplaceable capital at risk.
Lastly, a word of caution: please do your own research before placing a dime of your hard earned money into this market. Everything I write can only be considered as data for your own analysis. Nothing you have read here is investment advice, which is personal to your own circumstances that you should discuss with a trusted advisor. I am a speculator, and I take risks with my own capital that I would NEVER suggest others to take.
_________________________________________
By: Patrick G. Full-time independent trader in Atlanta, GA.
Patrick G is a full-time trader. Worked for a decade in a money management firm as a trader for high net-worth individuals.
He invested his and his family’s net worth into gold and mining stocks before the Covid money printing. Gold and commodity runs of the past 3 years allowed Patrick to trade full-time due to his gains.
Past performance does not guarantee future results. Trading involves significant risk of loss, and individual results vary. Positions mentioned are the author’s own, disclosed for transparency — not individual investment advice.

ATTN: Serious Options Traders
There Is Just ONE Epic Trade Every Week