
Category Archives for Uncategorized
ROKU Walk Through

On January 22, the following alert was sent to subscribers, before the open; W.D. Gann said the 50% retrace alone was a powerful trading concept. ROKU shows a 50% retrace of the last swing. Additionally, it is in the double down inside position or what I call a ‘crouch’. We are long from last week awaiting the potential turn up. ROKU should react one way or the other today: as the 58 high is straight across and opposite January 20-21 on my Square of 9 Wheel. The combo of pattern combined with a time/price square-out presents an interesting setup on this 1st 50% pullback in a hot new issue. This was followed up on, shortly after the open, with the following: Before the open, we sent a note on a long ROKU setup. Let’s look at this morning’s action. ROKU opened down but quickly turned up triggering an Opening Range Breakout (ORB). Notably, the down open did not violate the ‘crouch’ position. The down open followed by a breakout over the first half-hour’s range is what I call a Catapult ORB. In other words, ROKU pulled back the rubber band to kick off the week and found bids underscoring the viability of the setup. We will complete our pilot long position here at the market maintaining our stop. Good Luck, Jeff With the strength seen in ROKU, we sold half our position at 43 giving us a 2.16 gain. We are trailing the balance at 41. *UPDATE* Yesterday ROKU responded to a turning point mapped out ahead of time. As the Square of 9 below shows ROKU’s 58 all-time high is 180 degrees straight across and opposite January 22. (click here to enlarge) At the same time ROKU showed a 50% retrace of the last swing… offering an idealized long set up in tandem with a flush out of the 50 day line. A 10 min ROKU maps the action. A Boomerang buy signal was triggered following an undercut of Friday’s flat when price knifed back through the flat. An Opening Range Breakout confirmed the idea that ROKU had found bids and was poised for a ramp higher. The little opening decline set the trap door as buyers were waiting. Subscribers initiated a pilot position last week at 40.66 and completed it yesterday morning at 41.02 for an average cost of 40.84. We sold half the ROKU position yesterday at 43 and the balance on this morning’s spike.
Continue Reading -->Take T3 Live’s Bitcoin Survey
We’re taking a brief survey to get our readers’ thoughts on Bitcoin. It is completely anonymous, so feel free to give us your complete thoughts. P.S. Don’t forget to hit the submit button at the bottom! Loading…
Continue Reading -->Black Room – Profitably Trading Unexpected Gaps

Black Room Lessons Profitably Trading Unexpected Gaps Sami shows you how to spot the most profitable gap plays.>> CLICK HERE TO JOIN SAMI IN THE BLACK ROOM <<.
Continue Reading -->Black Room Afternoon List | Open House Training
Black Room-Building Your Afternoon List Watch Sami Abusaad review today’s list of stocks to trade.Then click here to join the open house this week. Watchlist Review with Sami Abusaad | Black Room Open House Day 2Onine Open House 11-27 to 12-1 How to Build an Afternoon Watchlist Watch this new video then register fot the live training. == > https://www.t3live.com/blog/t3-live-black-room-open-house/Posted by T3 Live on Tuesday, November 28, 2017
Continue Reading -->Black Room Game Planning | Open House Training 11-27-17
Black Room-Game Plan Video | 11-27-17 Watch Sami Abusaad review today’s list of stocks to trade.Then click here to join the open house this week.
Continue Reading -->Chef Scott Redler Shares His Secret Turkey Recipe

Family + friends + food + football + fitness (say that 10 times quick!) makes Thanksgiving one of my favorite holidays. And believe it or not, I’m pretty handy in the kitchen. I cook like I trade, and I trade like I cook. I keep things simple, and I go with what works. I’ve been using this turkey recipe since my parents moved to Florida 14 years ago, and it’s what I’ll be serving my family on Thursday afternoon. Ingredients List Turkey 3-4 long celery sticks 2 sticks of butter 2 oranges 3-4 lemons 2 sticks of butter 4 whole onions 3 big hunks of garlic Salt Pepper Paprika Ms. Dash seasoning 1 can of pineapples 1 jar of orange or apricot jam The quantity of ingredients depends on the size of your turkey. Just scale up or down as you see fit. We usually get a frozen 20-pounder. And oh yeah — make sure you have a quality knife! It will make your life a lot easier. I’ll take the bird out of the freezer Monday morning so it will be defrosted by Wednesday evening, when I do my prep work. You know me. Whether I’m trading, running, or cooking, I never show up for battle unprepared. If you start getting things ready before Thanksgiving, you’ll get better results with less stress on Thanksgiving… just like in trading! I’ll dice up 4 whole onions and 3 big hunks of garlic, and toss them in a large bowl. I then add salt, pepper, paprika, some Mrs. Dash seasoning, and mix it all up. Then, I’ll stuff it into the turkey. I’ll also put half a can of pineapples in there, and jam a stick of butter right in the middle of all. Then, I pour some orange juice and lemon juice over the turkey skin — just enough to get it wet. In a separate bowl, I’ll mix up more salt, pepper, and paprika for the skin. I spread it all over, making sure to get in all the nooks and crevices. Don’t be cheap! Then, I’ll wrap the turkey in a big bag and leave it in the refrigerator overnight. On Thanksgiving morning, I’ll cut a few long celery sticks in half and put them on the bottom of the pan. Then, I take the turkey out of the bag and place it on the pan. There will be a lot of juice in the bag. Transfer it to the bottom of the pan, and be careful not to spill any. It’s a real pain to clean up! Then I’ll mix up more salt, pepper, and paprika, and sprinkle it on top of the turkey. Now it’s time to stick the bird in the oven. After an hour, start basting it every 15-20 minutes. Take juices from the cavity and squeeze it on top of the turkey. Also, rotate the pan every hour or so. It should take about 4 hours to cook. Just follow what your meat thermometer says. When there is about 20 minutes to go, pour a jar of orange or apricot jam in a bowl, and add a softened stick of butter to it. Mix it together, and brush the turkey with it. Stick the turkey back in, but keep a close eye on it. We want a nice crispy skin, but we don’t want to burn it. Once the turkey’s done, take it out and let it sit for an hour before you carve it. By the way, if you’re not experienced in the art of carving up a turkey, this video will help you get it right and impress your family: Delay your carving as long as you can — turkey tastes best just when it’s cut! If you give this recipe a shot, take a picture, post it on Twitter, and tag me (@reddogT3) so I can see it! Have a great week, and an even better Thanksgiving!
Continue Reading -->How to Fix Broken Trading

Are you too busy trying to be right to make any money… Once you understand, and USE this lesson, everything changes.If you’re like me, you word hard. Every day you scan hundreds of charts looking for money, and looking for the clues you missed. Clues that would have indicated “hold this trade longer,” “don’t take this trade,” that type of stuff.You believe if you find the answer THEN you will be profitable. I have news for you, I did that for years, and never found it.But I DID stumble into how to fix my inconsistency. It was practically an accident. I wanted to build a list of stocks to scan, my software required me to add shares to the portfolio, so I gave all 100 stocks 100 shares.Every day I logged in and scanned for ideas, completely ignoring the actual portfolio because I was only looking for setups.One day I noticed the portfolio was profitable. There were A LOT of losing trades, but the aggregate was profitable. I sat up and said, “huh, that’s interesting.”Normally I would find a few stocks to trade. If they met my criteria I would cherry -pick which ones I believed would be good trades.After my discovery, I tried something different, I traded every stock in my list, for 100 shares, with real money. When I got a signal, I entered without hesitating.No second-guessing, just enter them all.A funny thing happened. When I released myself from “being right,” and just let my edge do the work, trading became more profitable, AND LESS STRESSFUL. That was the day everything changed. Trading became fun again, and I finally felt like I could do this for a living. I no longer I felt like an impostor.Now I had control. The more trades I made, the more I earned. I was allowing my strategy to do the heavy lifting.Making this work of course, requires good trades, high-probability ideas. Now that you know HOW to fix broken trading, I’d like to ask you to give us 30 days.Give us 30 days to find your next $1,000.If you aren’t hitting your goals, if you’re trading is boom or bust, invest $7 for the next 30 days and get up to 200 high-probability trade ideas.Join the Daily Market Report with Jeff Cooper. Just $7 for the next 30 days. Get started here…
Continue Reading -->Trading Scans | The Foundation for Winning Trades
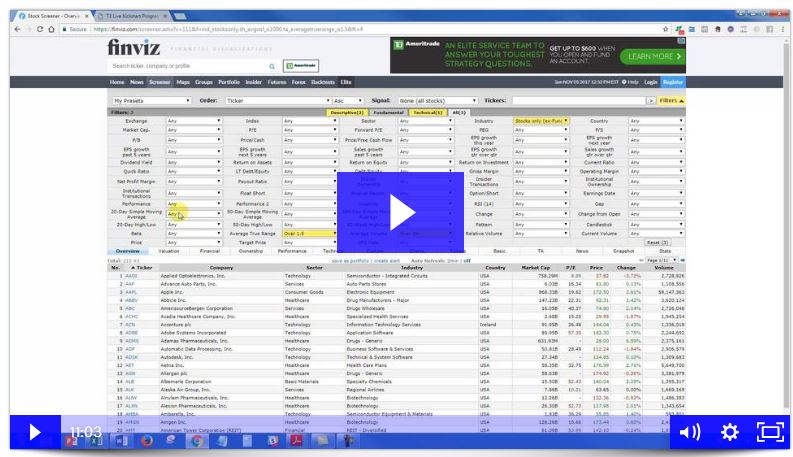
Additional scans below the video.A quick note about the scans. Have some fun combining them to find even greater opportunities such as a bullish momentum trade combined with double normal volume = a potential capitulation signaling the end of recent momentum (and a place to book profits) or an explosion out of a consolidation (that leads to an all-new trend!) Scan Criteria: Bullish Trends: Performance “month Up” + 20 day simple moving average “price above SMA 20” + price “over $20” + 50 day simple moving average “price above SMA 50” + 200 day simple moving average “price above SMA 200” + Industry “stocks only” + Average true range “over 1.5″ + Average volume ” Over 2 million” Bearish Stocks: Performance “month down” + 20 day simple moving average “price below SMA 20” + price “over $20” + 50 day simple moving average “price below SMA 50” + 200 day simple moving average “price below SMA 200” + Industry “stocks only” + Average true range “over 1.5″ + Average volume ” Over 2 million” Double Normal Volume: Price “over $10” + Average True Range “over 1.5″ + Average volume ” over 2M” + Relative volume “over 2” + Industry “stocks” Short-term bullish momentum: Performance ” Month up” + Price “over $10″ + Performance 2 ” Week up” + Average true range “over 1.5” + Average volume “Over 2M” + Industry “stocks” + Change from open ” up 2%” Short-term bearish momentum: Performance ” Month down” + Price “over $10″ + Performance 2 ” Week down” + Average true range “over 1.5” + Average volume “Over 2M” + Industry “stocks” + Change from open ” down 2%”
Continue Reading -->2017: The Year of Zero Panic… for Now
“Life can only be understood backwards; but it must be lived forwards.” -Soren Kierkegaard The Fed said they would continue to tighten and was perceived as more hawkish and the market fell for a half hour before the Fed likely stepped in to support the market while Yellen was speaking. Today or tomorrow, we should get an idea if there are real sellers around. Most NAZ names are under selling pressure and were flat or being sold yesterday while ETF’s supported the market. The Decennial Cycle was a major factor in W.D. Gann’s forecasts of the stock market. This refers to years ending in 2 being good lows and years ending in 5 being strong rally years in what Gann called the Year of Ascension. Years ending in 7 often were marked by panicky selling. The 100 year cycle is the mother of the Decennial Cycle. The crisis that began in 2007 was 100 years after the 1907 Rich Man’s Panic. It didn’t matter that there were not collateralized debt obligations. The cycles still exerted their influence. A further 100 years back to 1807 saw major panics in the US and Europe related to trade and war which evolved into depression. 1995 to 2000 marked a runaway bull market. The same occurred between 1895 and 1900. Ditto 1795-1800. However, 2015 was not a Year of Ascension in the stock market. It was more or less flat. Subsequently, the market played upside catchup. Likewise, 1927 did not see panicky selling. The result was that the continued ramp in the market into 1929 means that the cycles played an ugly game of downside catchup in 1929. Likewise, we have not seen panicky selling in this year ending in 7, 2017. The year is not over. Did you ever wonder why October has seen so many blood baths in the market? October is the 7 month (7 symbolizing panic, completion) from the ‘natural’ beginning of the year, March 21. We are going into the 7th month of a year ending in 7. Tomorrow is the Autumnal Equinox, the day that the legendary W.D. Gann called the day more likely to see a trend reversal than any other day of the year. Tomorrow’s report will examine some of the reasons why Gann thought the fall equinox was so important. Suffice to say that the days surrounding this particular fall equinox may be the most historic in 6,000 years according to the constellations. As for the significance of the fall equinox in the markets, there were the October massacres of 1978 and 1979 and the crash of 1987, the mini crash of 1989, the 1997 Asian collapse and the Long Term Capital Market plunge. Gold stocks topped on September 22 in 1980 which tied to the peak in may oil stocks that year. (Remember that the all-time high in gold was also in a September in 2011). Going back further, on September 22, 1929, the Dow Jones Utility Index became the final major average to make high before the Crash of ’29. The lesson there being that money ran into utility stocks after other stocks topped on September 3 that year, but that ultimately there is no place to run and no place to hide when panic hits the tape. Everything is a source of funds when indiscriminate selling is let out of the cage and the margin man cracks his whip. In 2008, the markets went into freefall in the days following the collapse of Lehman Brothers. The fall equinox that year marked chaos in the markets when the House of Representatives rejected TARP. Currencies have seen historic changes around this date as well. The British pound was removed from the gold standard and devalued 28% on September 21, 1931. On September 22, 1985, the Group of Five produced the Plaza Accord, which perpetuated a sharp decline in the dollar and expansion of global liquidity. There was a Black Wednesday on September 16, 1992 when Britain was forced to withdraw from the European Exchange Mechanism. Treasury note and bond yields made their historic highs in late September 1981. That marked the end of a 35-year bond bear market from the end of WW2. We have seen a 35 year bull market in bonds since that time. The beginning of September 2000 was the test failure high in the SPX of its March high that year. This year we saw an important high in March at 2401 SPX (an important level) and 6 months later the SPX hit 2509… an important range of 108 points 180 degrees later. We will delve more into the significance of 108 tomorrow but 3 X 360 is 1080 and in Gann and in geometry, you can always move the decimal point. Three is one of the secrets in Gann’s coded novel The Tunnel Thru the Air found on page 69. Conclusion. So what is the setup going into this Autumnal Equinox? The dollar had a big day yesterday and continuation above 93.50 could be a sign of a change in trend. Alternatively, a failure here should see an accelerated decline in the dollar in October. Oil is flirting with a breakout over 51 which could see 55. The oil stocks have come to life in recent weeks and our OAS and FMSA swing positions have been working nicely. Gold has pulled back to test the double tops at 1300. I did not think it would pull back this far, but if a new leg up starts and exceeds the recent highs and 1360, it should mark a strong advance. So in that respect, this reaction could be simply pulling the rubber band back for a major move. The semi-conductor stocks saw a sharp break yesterday on issues and orders concerning the new iPhone and watch. A weekly SOX shows a large range weekly reversal bar on the week of June 6. The SOX set a new high above the former peak and a quick stab lower will issue a weekly Soup Nazi
Continue Reading -->T3’s Trades of the Week: Is TSLA All Charged Up After the Long Weekend?
Welcome to the latest edition of T3’s Trades of the Week newsletter! Have you heard about Redler Ultimate Access, Scott Redler’s all-new education program? Click here to learn about how you can learn Scott’s best trading secrets.. Now let’s jump right in to this week’s trades and analysis: 1) Scott Redler on TSLA TSLA is getting tight as the upper pennant builds. Some are long from the Red Dog Reversal at $339.72. If it can hold $351 and then clear $357.50 with authority, we can add for a trade. Click here to learn about Redler Ultimate Access, Scott’s all-new education program 2) Jeff Cooper on Advance Auto Parts (AAP) I am watching AAP for a short swing trade. I would enter short at 97.50 and keep a stop at 99.50. My target for half of the position is 95.50. If it hits that target, I would cover half and move the stop down to 97.50. Click here for information on Jeff’s 181-page trading case study 3) Kurt Capra on USDJPY USDJPY bounced hard last week after taking out the prior pivot low. This morning it is trying to push back down. The action here should not come as a complete surprise as this area is a long term support level. A decisive break and close under this area will signal a much more significant move lower is to come. I am looking for this to move back to the prior low as a first step. Click here for Kurt Capra’s forex trading case study
Continue Reading -->