
Tag Archives for " Jeff Cooper "
How to Save 50% on Our Black Friday Sale

EDITOR’S NOTE: Our 2018 Black Friday Promotion is over. If you have any questions, call 1-888-998-3548.–> Click Here for Our 90% Off Cyber Monday Sale 00 Days 00 Hours 00 Minutes 00 Seconds How to Save 50% With Our Black Friday SaleTIP: you actually don’t have to make any payments today! If you qualify for PayPal financing, you can set up a payment plan with 6 months of interest-free financing. Just select PayPal at checkout and you’ll be on your way. 1) Click to Visit Our Black Friday Sales Page2) Add More than $2,500 Worth of Products to your Shopping Cart3) We Take 50% Off!That’s it. Everything on the page is on sale, so now is the time to get in.Choose how how much you want to save – $1,250, $2,000, or even more!(Please Note: Black Friday bundles are not refundable)Get Your Deal Now ==>Helpful Hint: After you add something to your cart, click the “Continue Shopping” button add additional products.If you’re ready to invest in your own P&L, now’s the time.Pay just $1,250 for $2,500 worth of services — or save even more, if that’s what you want.So if you’ve been eyeing an upgrade from a monthly to an annual subscription, or getting some new training, now is the time to act.Need Help Deciding?Call 1-888-998-3548 for help from one of our friendly Trading CounselorsSick of watching time go by without earning a steady P&L?Want to finally learn options, forex, or technical analysis?There is no time like the present. For less than the cost of 1 bad trade, you can get on the road to success.Click to Get Started ==>
Continue Reading -->Shake-Out Or Correction?

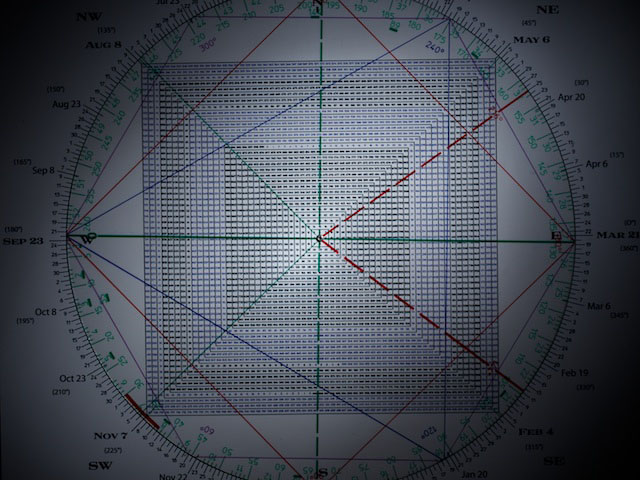
They say the trend is your friend, but is the trend bending? How can one determine the trend? First you have to define trend. Trend is different for every trader. It depends on the time frame they are trading. Then you must know that there are trends running concurrently like a double helix. There are many methods and strategies that market participants use to determine when a pullback is a buying opportunity or a pullback is something more than a pullback. The 3 Day Chart and the 3 Week Chart are two of the best tools I know of to determine the near term trend and the intermediate trend. The 3 Day Chart turns down anytime there are 3 consecutive lower daily lows OR a prior circled 3 Day low is violated (a prior swing low which marked a trough). The 3 Day Chart turns up with 3 consecutive higher highs or on trade above a prior circled 3 Day Chart high. The 3 Week Chart turns down anytime an item shows 3 consecutive lower weekly lows—or on trade below a prior circled 3 week circled high. The 3 Week Chart turns up anytime an item shows 3 consecutive higher weekly highs —or a prior 3 week circled high is cleared. Let’s take a look at an SPX daily from the last major swing low on August 21st. The last time the 3 Week Chart turned down was on the week of August 21. The index set a low at 2417 on an undercut of its 50 day line. The last time the 3 Day Chart turned down was on November 15th. Notice that there was roughly 90 days/degrees between the August low and the November low. The natural 90/180/270 and 360 day/degree divisions of the year are integral to Gann analysis. The November 15th turndown of the 3 Day Chart also was a test of the 50 day moving average. Today the SPX is poised for a possible turndown of its 3 Day Chart if it trades below yesterday’s low. This will trace out 3 consecutive lower daily lows. Importantly, this is occurring as the index satisfies a 90 degree price pullback. From last Friday’s record 2872 high, 90 degrees down is 2818. Notice that despite the selling pressure of the last two days the SPX has held 2818 on a closing basis. It slipped under 2818 yesterday to a low of 2813 but recovered to close at 2823. Importantly, January 31, yesterday, is 90 degrees square the number 2813 on my Square of 9 Wheel. So we have so to speak, a double square-out on the table: The SPX has satisfied a 90 degree price pullback. Yesterday was a possible time/price square-out with 2813 being 90 degrees square of January 31st. It’s still a bull market so these square-outs must be respected. That said the 3 Day Chart has not turned down yet. It could do so today. Trade below Wednesday’s low that that sets a low and turns up either today or Friday suggests a low of some degree. However there are a few caveats that suggests this time is different that November. First of all the index is dealing with a Break Away gap directly off an all time high. It looks like a Gallows Hangman pattern. This suggests last Friday’s rip was a Buying Climax…at least in the short run. Additionally, the SPX is stretched well above its 50 day moving average—a conspicuous difference between the August and November lows. The presumption is that if the SPX turns down its 3 Day Chart and it does not define a low, it’s going lower. The indication is that if 2818 and 2813 fail to act as support, the SPX is headed lower. The conclusion would be that we have a change in character and that rather than a shakeout, a more meaningful correction is playing out. So let’s do the geometry. A 180 degree decline from high is 2766. 360 degrees down is 2662. This would be one full cycle in price down from the 2872 record high. There is some good symmetry to the idea of a decline to around 2662. It represents a 50% retrace of the last leg up (from the August low). It marks a little burst of volatility in early December which was the mid-point of the rally. 2662 also ties to a test/undercut of the 50 day line. Additionally, a decline that flushes the 50 day satisfies a test of a trendline connecting the August low and the November low. The January low is 2682.36. Trade by one tick below that level in February would also satisfy a turn down in the Monthly Swing Chart. If that occurs, bull or bear, the strong likelihood would be for a continuation of the bull or a reaction higher even if a bear market is on the table. The last time the Monthly Swing Chart turned down was in November 2016. It’s stretched. The probabilities are that it will turn down. If it does not do so in February…180 degrees/days from the August low, it may do so in March on trade below whatever the February SPX low is…going into the NINTH anniversary of the March 2009 low. Whenever it turns down, it will be a significant inflection point. Be that as it may, the price action here going into the weekend will tell the tale as to whether we’re in just a short-term shakeout or a more meaningful correction is on the table. Because 2 X the 455 point range of the leg up from August is the range of the 910 point bear market from Oct ’07 to March ’09, the symmetry suggests that the 2872 high (a square-out as January 26 is 180 degrees opposite 2872) may have marked the end of a significant Buying Climax—one which should at least see the deepest correction in the last 14 months. Interestingly, 455 is opposite the date of March 6th…the low
Continue Reading -->ROKU Walk Through
On January 22, the following alert was sent to subscribers, before the open; W.D. Gann said the 50% retrace alone was a powerful trading concept. ROKU shows a 50% retrace of the last swing. Additionally, it is in the double down inside position or what I call a ‘crouch’. We are long from last week awaiting the potential turn up. ROKU should react one way or the other today: as the 58 high is straight across and opposite January 20-21 on my Square of 9 Wheel. The combo of pattern combined with a time/price square-out presents an interesting setup on this 1st 50% pullback in a hot new issue. This was followed up on, shortly after the open, with the following: Before the open, we sent a note on a long ROKU setup. Let’s look at this morning’s action. ROKU opened down but quickly turned up triggering an Opening Range Breakout (ORB). Notably, the down open did not violate the ‘crouch’ position. The down open followed by a breakout over the first half-hour’s range is what I call a Catapult ORB. In other words, ROKU pulled back the rubber band to kick off the week and found bids underscoring the viability of the setup. We will complete our pilot long position here at the market maintaining our stop. Good Luck, Jeff With the strength seen in ROKU, we sold half our position at 43 giving us a 2.16 gain. We are trailing the balance at 41. *UPDATE* Yesterday ROKU responded to a turning point mapped out ahead of time. As the Square of 9 below shows ROKU’s 58 all-time high is 180 degrees straight across and opposite January 22. (click here to enlarge) At the same time ROKU showed a 50% retrace of the last swing… offering an idealized long set up in tandem with a flush out of the 50 day line. A 10 min ROKU maps the action. A Boomerang buy signal was triggered following an undercut of Friday’s flat when price knifed back through the flat. An Opening Range Breakout confirmed the idea that ROKU had found bids and was poised for a ramp higher. The little opening decline set the trap door as buyers were waiting. Subscribers initiated a pilot position last week at 40.66 and completed it yesterday morning at 41.02 for an average cost of 40.84. We sold half the ROKU position yesterday at 43 and the balance on this morning’s spike.
Continue Reading -->Feeding the Ducks?
An historic contraction in volatility this year cooked up a whack-a-mole stew of selling volatility. Every time the market got hit, it was just another Sunday at Church for the Buy the Dip Congregation. Lately, it seems like it’s Sunday every day. The bounce back from last Wednesday’s air pocket set the land speed record for baptism by fire with the market jackknifing back into safety before you could say Lazarus. Never underestimate the scent of a ‘free lunch’ to lure the best and brightest financial engineers on Wall Street, the only place where the caboose always is in front of the engine. In other words, it’s always the derivatives, leverage, and tangential strategies that drive the money train. You don’t make the billions the banks and hedgies do with plain vanilla. When a political snowball from hell rolled onto The Street last week with the SPX hovering just below all-time highs and option expiration just days away, players who sold volatility were in jeopardy of choking on their own free lunch strategies. So in the best tradition of a bull in a China shop, it looks like players had no choice but to throw a Hail Mary into the fray and put on a Squeeze Play beginning last Thursday. What better way to do this then to let Wednesday’s selling run its course and close on its low before jacking this 18-wheeler back up out of the blue. Well it wasn’t completely out of the blue. Mr. Geometry lent a hand with the SPX closing directly 90 degrees off the key 2401 level last Wednesday. While a week ago, all hell broke loose and it looked like the SPX would finally test the key 2280-2300 level or worse, today, the hall of mirrors at 2400 is back in play… again. This must be the 7th attempt to covert 2400. I’ve lost count. The action certainly speaks to the idea that ‘There’s Something About 2400′ as we flagged before March. Some think the bulls have run out of money with a Big Seller sitting on 2400, or that there’s a lot of hedging going on there. Maybe, but underneath the surface, a handful of ‘Nifty Fifty’ names have been ripping higher. These include our old friends AAOI, SHOP, LITE, TTD, PFPT, WDAY and IRBT as well as the runaway Chinese Brigade, WB, SINA and SOHU. If I owned a major fund, this would be my strategy: I’d keep the indices flat below a ceiling of say 2400 and buy my belly full of stocks, keeping the crowd in suspense and competition at bay as they sold each time the index kissed 2400, only to be rejected. Then I’d add to my longs on each pullback. Once and only once I was ready, I’d let the SPX vault 2400 and start feeding the ducks, distributing positions into the quacking now that the ‘coast was clear’. I’m just sayin’: if it looks like a duck and quacks like a duck… The bulls would love nothing more than to get a close meaningfully above 2400 going into the long weekend. With names like X creeping higher as flagged yesterday and IBM catching a bid this morning, and with energy names getting a lift from $50+ oil, the junkyard dogs may create enough of a tail wind to chase the SPX over 2400 into early June, where a possible time/price square-out is on the table. However, I’m not so sure a breakout is an all clear: if the SPX satisfies our long outstanding target over the next few weeks, the bite of the bear may ultimately prove worse than the bark of the bulls.
Continue Reading -->Jeff Cooper’s Morning Call Express: Respect Your Stops

In today’s Morning Call Express, T3 Live’s Jeff Cooper breaks down the action in SPX and talks about the important of stops. Click here to learn more about Jeff Cooper’s Daily Market Report.
Continue Reading -->Jeff Cooper’s Morning Call Express: Financials Up
In today’s Morning Call Express video, T3 Live’s Jeff Cooper breaks down the action in SPX and the financials. Click here to see Jeff Cooper’s incredible track record.
Continue Reading -->Morning Call Express: The Pattern of a Potential Bull Trap
In today’s Morning Call Express, Jeff Cooper talks about the potential of a bull trap in the SPX and wonders if an Orange Swan event is on the table. He also talks about the key levels to be watching for clues to a significant correction. Jeff also talks about several cycles that he has been cautioning his reader about.
Continue Reading -->Morning Call Express: Biggest Mover of the Week, Gold
In today’s Morning Call Express, Jeff Cooper talks about the big move in gold this week. He highlights some of the key levels that he is focused on based on Gann methodology and the sqaure of 9 wheel.
Continue Reading -->Morning Call Express: A Closer Look, Dow Jones Industrial
In today’s Morning Call Express, Jeff Cooper talks about the potential head and shoulders top on the Dow Jones Industrial and the action seen yesterday. If support is broken, a test of the 200 day moving average is on the table. He also talks about the Gann connects which are in play.
Continue Reading -->The Point of Gold Recognition?

A few days ago we offered that GDXJ/GLD were at inflection points and that the next leg up to 1425/1450 in gold may be here. Yesterday may have been the first step. The behavior on the first pullback will be key to observe with subsequent follow through. If GDXJ offsets $49-50, which from a bearish perspective is a right shoulder of an H&S top, that should confirm the idea of a new leg up because fast moves come from failed patterns. A failed Head & Shoulders top implies new highs in GDXJ. Moreover, new swing highs in gold will be a point of recognition for those bearish of gold who believe this years rally was a bear market rally. New highs could create a vacuum as the perception that a bull market in gold is underway takes hold. Click here to learn more about Jeff Cooper’s Daily Market Report.
Continue Reading -->