
Knowing When To Press Your Bets
Last week I laid out my case for a top in long rates on US Treasury Bonds. This week, I’m growing more confident that an important low in the price of US Bonds has been made. However, I’m still a fair weather fan, so I’ll be out in a heartbeat without remorse if my stops are hit.
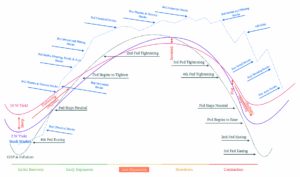
It’s been my view that we are in the contraction phase of the business cycle, and if that view is correct, we should see growth and inflation expectations start to come down for 2027. This shifting dynamic is what can finally put a bid under US Bonds. This is because there will always be demand for income.
When I was running an equity portfolio for a small RIA shop, I had to stretch way out the risk curve far beyond where I was comfortable playing to get the portfolio yield just barely into the 3% figure. I was buying foreign telecom OTC equities to get there. This was during the financial repression of the QE era, and it was not a good time to be a dividend portfolio manager.
Today, we are being offered higher yield, even above what I had to stretch for back then, in a money market. You can lock in way higher than that if you are willing to extend duration a decade or more. The TLT, my preferred way to play the top in yields, pays a monthly div of ¢33, about 4.7%. This may not look exciting compared to the gains you can get from a well placed equity trade, but believe me, 4.7% return with no risk is nothing to shake a stick at. The unfortunate reality is that at the moment, there is nothing more attractive than US Bonds for my irreplaceable capital.
I’ve been in about 75% cash since March, 2026 when I peeled off the last of my gold miners I was willing to part with (I’ve still got my core position in the big 5 miners) so I’ve been looking for another core position in which to allocate. Stocks are just not attractive other than trades right now because they are all trading at about 20x pretax earnings across the board; no matter what sector you look at, every single stock worth owning trades at basically 20x what you can expect it to earn every year.
The only exceptions are the oils like XOM and CVX which trade about 15x and my favorite fertilizer, NTR, which trades about 12x what I estimate is an average of earnings over a cycle. These names can still offer potential for reward with the small chance of an energy or grain price spike, but the risk is shifting to the downside as the Iran conflict seems to be nearing a conclusion, or at the very least, a de-escalation.
Any way I analyze the attractiveness of stocks for ownership, I come up lacking any justification for anything other than renting specific names for a trade. In an environment like this, it’s best to just stick with the easy trade, and for me, TLT is the easiest one out there.
If the lows of this week hold in TLT, then my focus will shift towards deciding where to add. Proper speculation requires only averaging up, never down. Stan Druckenmiller said the key to his success was forming a trade idea, putting on a position, then really stepping on the gas and levering up when his position started to work. I want to apply the same logic to TLT. The first step is seeing the TLT hold the lows of this week at about $81.75. The next step would be to see some strength above $83. A weekly close above $83 on strong volume would be some indication that it would be time to press on TLT with tight stops below $83.
This TLT play feels a lot like my gold trade that won me the ability to trade for myself, but this time, I’m going to apply the lessons I learned from that campaign. I did almost everything wrong during that speculative campaign: I averaged down, didn’t have a trade plan, didn’t use stops, had no risk control, etc. The only thing that made the trade work out for me was size. I was 90% long in one sector because I was confident in my analysis. I used 8th grade math to plot the dollar value of US debt going back 50 years, and used an R-squared regression to get a y=mx+b equation. I plugged in the year 2030 for “b”, and got $45T for our debt. I then took the current portion of foreign held debt outstanding at 20%, and I asked, if even 1% of that dollar value shifts to gold, what would the supply and demand balance look like? It turns out, that at the time I performed this basic analysis in 2023, the new demand for gold would be 4.5 tons at the $2,000 price gold was then, and new supply would be only 2 tons by 2030. It was a no brainer, and the trade worked out.
This time around, I’m going to still rely on my analysis that we’re in the contraction phase which means growth and inflation should be coming down, but I’m going to adhere to strict risk controls to put on my TLT allocation. Each time I see a higher low hold, I’ll treat that as a new tactical spot to buy stock to add to my strategic core position. Like Druck’s playbook, if the trade starts to work, then and only then will I add.
The reason I can be so confident in my analysis that we are in the contraction phase, is because all the signs I’ve been looking for are appearing. I’m relying on signs to form a checklist approach to pinpointing the turn in the cycle rather than hard data points because a data-driven, statistical modeling approach is notoriously wrong at turning points. Modeling is only good when you’re in the middle of a cycle and you want to determine trend or degree of economic activity. That is an approach for institutional money, and I think it has too many flaws to be relied on for the type of speculation that lies within my wheelhouse.
For myself, figuring out the next big trend where I can park capital and ride it out is the only pursuit worth my effort. In that vein I’ve developed a checklist to determine the likelihood we are at the contraction phase of the economic cycle:
- Previous 6-12 months has been a time of higher inflation
- Previous 6-12 months has seen late cycle stocks like energy and materials outperform
- Previous 6-12 months has seen gold price surge
- Federal Reserve successfully completed rate hike cycle
- Federal and local government revenues surge in a flurry of economic activity
- Civil construction projects accelerate with record municipal tax revenue
- Real estate prices near highs but transaction volume stagnating
- Weakness in housing and home furnishing stocks
- Yield curve coming out of inversion and steepening
- Defensive sector stocks like grocery, medicine, and banks starting to outperform
- Emerging market weakness
- Weak auto sales in developed markets
- Unemployment at cycle lows
- Consumer loan balances at cycle highs
- Stock margin balances at cycle highs
While these individual checklist items are open to some degree of interpretation, a general sense of the likelihood of a turn in the cycle can be surmised from the overall agreement of the checklist with observed conditions. Pretty much every single one of these items has been checked off, but perhaps the most important anecdotal indicator I know of is not on this checklist, as it is completely subjective. It’s a sign of excess that can’t be exacted to a statistical data point, but I call it my “Hummer indicator.” This indicator is entirely personal to me; it was 2007 and in suburbia, Hummer H2’s were popping up everywhere. Soccer moms where ridiculing $4 gasoline by driving around pretend tanks to pick up their groceries, as though the paved, lighted streets from their brick-walled subdivisions to their kid’s private schools were as perilous as navigating the streets of Fallujah. Hummers have been seared into my memory as the ultimate indicator of a top.
I’ve been a bear since my formative years in the market during the 2008 GFC, but I’ve never had the perfect checklist tick off like this. The Hummer indicator is the icing on the cake for me. I’ve been on the look out for a sign of excess like the Hummer H2 for years, never really knowing exactly what I was looking for. But now with the Hummer EV, I’ve got it. I couldn’t have imagined that the indicator I was waiting for would be an almost exact replica of the sign of excess I witnessed during the top of the last cycle. It’s a perfect sentiment indicator of the excess in the psyche of the American consumer.
Excesses like this don’t get worked out slowly from the economic system. They tend to be expunged suddenly and violently. The reason for that is due to the sheer amount of capital invested in getting these expensive novelties to market.
The same dynamic exists with AI. A long duration asset like a data center requires low interest rates to be economically viable. The US intends to become an “AI superpower,” whatever that means, but in order to do so, we will require vast amounts of natural resources. At the moment, those resources are being diverted to delivering novelty goods, such as the Hummer EV, to the marketplace. At some point soon, the captains of industry will have to choose how to allocate scarce resources.
Traditionally, price has given that signal, but as I’ve written about, we are now in an interventionist market where price signals lose some of their amplitude. This is why an unwind of the malinvestment could come abruptly, rather than slowly and steadily as price would have forced discipline on capital allocation. We are going to have to choose between structural productivity enhancements for the benefit of all or expensive novelty toys for the elite.
I assume we will choose wisely, but the capital that has been spent to bring novelty to the market will have to be written off. That is very negative for growth, but positive for long duration, risk free assets. It’s when the realization that the visions of the future were miscalculated becomes manifest and expectation for growth becomes realistic that the value of the anti-growth asset becomes understood by market participants. When they finally come to this realization, then I’ll be a willing seller to them.
Lastly, a word of caution: please do your own research before placing a dime of your hard earned money into this market. Everything I write can only be considered as data for your own analysis. Nothing you have read here is investment advice, which is personal to your own circumstances that you should discuss with a trusted advisor. I am a speculator, and I take risks with my own capital that I would NEVER suggest others to take.
_________________________________________
By: Patrick G. Full-time independent trader in Atlanta, GA.
Patrick G is a full-time trader. Worked for a decade in a money management firm as a trader for high net-worth individuals.
He invested his and his family’s net worth into gold and mining stocks before the Covid money printing. Gold and commodity runs of the past 3 years allowed Patrick to trade full-time due to his gains.
Past performance does not guarantee future results. Trading involves significant risk of loss, and individual results vary. Positions mentioned are the author’s own, disclosed for transparency — not individual investment advice.

5 Days Free in a $7,000 Trading Room
Trade alongside David Prince live, Oct 26–30