
Tag Archives for " volatility "
The Sub-10 VIX Is About to Set a Crazy Record

Min Zeng of the Wall Street Journal just Tweeted a very interesting stat about the VIX: $VIX at 9.75, on pace to close under 10 for the seventh time this year–the most ever. I double-checked the data and indeed, Zeng is correct. But taking a deeper look at the data (my data set goes back to 1990), things get even more bizarre. All 6 of 2017’s sub-10 closes in the VIX happened on May 8 or later. (remember, today’s would make lucky number 7) And if get another sub-10 close, that would mark 5 in the past 7 sessions. Since 1990, the VIX has NEVER closed below 10 in 5 out of 7 sessions. So it’s on the verge of a truly incredible record. Already, the VIX has finished under 10 in 4 of the last 6 sessions. This has only happened 3 other times since 1990. Those 3 other occurences were on 12/28, 12/29, and 12/30 in 1993, during a streak when the VIX had 4 straight closes below 10. So the post-election collapse in volatility truly is remarkable. Now let’s take things a step further. Prior to May 8, 2017, there were only 9 sub-10 closes in the VIX. That’s right. Just 9 out of 6,891 trading days — or 0.13% of the time. And now we’re going on 5 in just 7 days — or 71%! This looks insane, but let me explain why it’s perfectly logical. The VIX represents expected volatility. And when actual market volatility goes to near-zero — as it has since President Trump’s victory — the VIX follows. Therefore, the VIX’ behavior is entirely logical. Anecdotally, I’ve been hearing a lot of traders chat up long positions in VIX-related instruments like VIX calls or VXX calls, or plain old SPY/SPX options. I’ll just leave you with one of the great all-time market one-liners: “The market can stay irrational longer than you can stay solvent.” -John Maynard Keynes 2017 has been BRUTAL to traders betting on a rebound in volatility. You can know why it should happen, but you had better know when, or else you’ll be eaten alive by time decay, one penny at a time. So if you’re going to put your chips down… be very careful.
Continue Reading -->Volatility Hits a 55-Year Low: Is a Trump Slide Coming?
On Monday, I provided an in-depth analysis of the post-election collapse in volatility, just as the VIX was hitting levels not seen since February 2007. In that piece, I focused on day-to-day volatility of the S&P 500. Now, I’m going to take a look at intraday volatility. I used a very simple but effective formula to make my judgements. I took the day’s range (the high minus the low) and divided it by the prior day’s close Since 1950, the S&P has had an average intraday range of 1.2%. Since 2000, the average intraday range has been 1.4%. In 2016, that number was 1.0%… up until the election. And after the election, it dropped to just 0.6%. So just as day-to-day volatility dropped, intraday volatility has dropped just as much. Now here’s where things get really interesting… We’ve had 125 trading days since the election, with an average intraday range of 0.584% — half the long-term 1.2% average. (as of 1:00 p.m. ET) The last time we’ve had a 125-day stretch with so little intraday movement was March 19, 1962! If you’re falling asleep… you have good reason. And oh yeah — the S&P had a rough time after March 19, 1962. It closed at 70.85 that day, and fell to 52.83 on June 27. The market’s dip in 1962 was deemed “The Kennedy Slide.” Heck, there was even a Flash Crash on May 28, 1962, with the Dow falling 5.7%. Could we see a similar Trump slide? I guess it’s possible, mostly because it’s not uncommon for a bear market to be proceeded by a low volatility stretch. To balance that, I’ll issue my usual caveat: a sample size of 1 means absolutely NOTHING, and I do this kind of research mostly for entertainment purposes. And to be even more clear: I’m not rushing to get short the market in anticipation of a big drop. But for fun, let’s look at some historic parallels. The JFK Library said this about President Kennedy: John Fitzgerald Kennedy captured the Democratic nomination despite his youth, a seeming lack of experience in foreign affairs, and his Catholic faith. And in 2016, Donald Trump completely smashed the Republican establishment despite having zero political experience. Sheer charisma played a big role in each man’s victory. And in both elections, the market rallied after the result. What about geopolitical tensions? Kennedy had the Bay of Pigs Invasion in 1961 followed by the Cuban Missile Crisis in 1962. In 2017, we’ve got Russia, Syria, ISIS, etc. That’s quite a few coincidences to content with…
Continue Reading -->Bears Trump Bulls Ahead of the Presidential Steel Cage Match

Permabulls always say everyone’s bearish. And permabears always say everyone’s bullish. Neither side ever provides evidence for their views. So I regularly run through a variety of sentiment measures to get an accurate reflection of the market’s mood. According to 5 sentiment measures I track, traders are certainly looking bearish heading into November 8’s Presidential election. Donald Trump’s wild-card image seems to be roiling traders’ nerves because of all the possible variables. Does he win? Does he lose? Does he lose and contest the outcome? Who really knows at this point? So let’s drill down to the numbers: 1) AAII Sentiment – Bearish The latest AAII Sentiment Survey shows that just 23.6% of individual investors are bullish, well below the long-term average of 38.5%. But what’s really interesting is that bullishness has been below the long-term 38.5% average for 51 straight weeks, and 84 of the last 86. 2) ISE Sentiment – Bearish The ISE Sentiment Index is at just 31 this morning — that’s just 31 calls for every 100 puts. And the 10-day moving average is 80 — that’s the type of reading you see after a major volatility spike, not before one. 3) CBOE Equity Put-Call – Bearish The CBOE Equity-Put Call ratio has been over 1 for the past 4 days. That indicates serious bearishness. 4) CNN Fear & Greed Index – Bearish The Fear & Greed Index is at 17. F&G operates on a 1-100 scale, and 50 is neutral. This 17 reading indicates extreme fear. 5) VIX Spread – Bearish The 3-month VIX spread is at -0.3, which indicates traders are pricing in high near-term volatility. This is bearish. ********* So we have all 5 of these sentiment indicators pointing bearish, and they’re likely to get more bearish as traders hedge against possible post-election downside. Interestingly, I hear a lot of traders chattering about going long into the election on the assumption that downside is already priced in. We’ll certainly see!
Continue Reading -->T3’s Take 3: Volatility Is Back in a Big Way

T3’s Take 3: Volatility Is Back in a Big Way Interested in becoming a professional prop trader? Click here to fill out our eligibility form. ********* 1) Bulls Give Back Yesterday, the S&P 500 rose 1.5%, the first 1%+ up day since July 8. The bears got their revenge today as the index dropped -1.5% to 2126.78, with the VIX rising 17.7% to 17.85. Market observers were scrambling to find explanations for the sell-off, but for me, the story remains the same: we are seeing a good old-fashioned return of volatility after 2 months of markets going nowhere. Some folks are pointing at deterioration in US economic data – but that’s nothing new. The real question is what’s next? There are no easy answers, but crude oil will be in focus tomorrow given inventory releases today after the close (from the API) and tomorrow morning (from the EIA). 2) Apple Booms on iPhone Sales Chatter Apple (AAPL) was a superstar amid a sea of red, rallying 2.4% to $107.95. Early this morning, T-Mobile (TMUS) Chief Executive Officer John Legere Tweeted that iPhone 7 pre-orders set company records. Sprint (S) CEO Marcelo Claure then jumped into the news flow and added that iPhone pre-orders were nearly 4X higher than last year’s. Consumers appear to be upgrading their iPhone at a faster-than-expected rate, and Apple may also be benefiting from a stumble by a key rival Samsung. Samsung recalled Galaxy Note 7 smartphone due to exploding batteries, which certainly tilts the iPhone vs. Galaxy debate in Apple’s favor. 3) VIX-Plosion Trade Update On August 9, I went long VIX calls, based on my expectation that the VIX could break over 30 within 2 months. We may now be seeing the seeds of such a move, so I don’t have plans to lock in profits just yet. On Friday, we had the first -1% down day in the SPX since June 27. Yesterday, we had the first 1% up day since July 8. And today, the SPX fell -1.5% with the Russell 2000 down -1.9%. The Nasdaq was ‘only’ down -1.1%, but that’s largely because of Apple’s (AAPL) rally. So it looks like the summer snoozefest has officially made way for some autumn excitement. Wednesday’s Trading Calendar US Economics (Time Zone: EDT) 07:00 MBA Mortgage Applications (9/9): prior 0.90% 08:30 Import Price Index MoM (Aug): exp. -0.10%, prior 0.10% 08:30 Import Price Index YoY (Aug): exp. -2.20%, prior -3.70% 10:30 DOE U.S. Crude Oil Inventories (9/9): exp. 4000k, prior -14513k 10:30 DOE Cushing OK Crude Inventory (9/9): exp. -100k, prior -434k 10:30 DOE U.S. Gasoline Inventories (9/9): exp. -1100k, prior -4211k 10:30 DOE U.S. Distillate Inventory (9/9): exp. 1500k, prior 3382k 10:30 DOE U.S. Refinery Utilization (9/9): exp. -0.35%, prior 0.90% 10:30 DOE Crude Oil Implied Demand (9/9): prior 17600 10:30 DOE Gasoline Implied Demand (9/9): prior 10250 10:30 DOE Distillate Implied Demand (9/9): prior 4655.9 Global Economics 04:30 GBP Average Earnings Index 04:30 GBP Claimant Count Change 04:30 GBP Unemployment Rate 18:45 NZD GDP q/q 21:30 AUD Unemployment Rate Earnings Before Open: Cracker Barrel Old Country Store (CBRL) After Close: Apogee Enterprises (APOG)
Continue Reading -->The Morning Hammer: Panic Is NOT Here

Throughout August, the market loved hawkish comments from Fed members. But by last Friday, traders had enough. The sold the market hard on Rosengren’s hawkish commentary. And of course on Monday, they bought the market hard on Brainard’s dovish vibes. Not that this is anything new, but the market truly is bizarro-land. Now, traders are pretty much taking a September rate hike off the table. Fed funds futures indicate a 22% implied probability of a September rate increase (down from 30%), while December is basically unchanged at 57%. Crude oil is down this morning after the IEA said oversupply will persist well into 2017. Remember that we have US crude inventory data coming from the API today after the close and from the EIA tomorrow morning. SPX futures are down -0.7% in the early going, which means volatility may really be back. Friday was the first 1% SPX down day since June 27, and Monday was the first 1% up day since July 8. And compared to the July-August snoozefest, a -0.7% move qualifies as real action! Bonds are firming up a little bit, with 10YR bund yields inching back down towards the zero mark. Treasuries are also up a tad. Gold is up as dovish vibes come back, though the volatile gold miners (GDX) are red pre-market. If gold stays strong in the early going, maybe those miners snap back up. Now the real fight begins. The bears failed at every turn for 2 months, but they’re starting to take the lead. And sentiment is still somewhat mixed, which for the bears is good because it implies the market is not braced for serious downside. The CBOE Equity put-call is 1.03, which is bearish but not extremely so. The 3-month VIX spread is +1.98, which is neutral. And the 10-day moving average of the ISE Sentiment Index is 87.4, which is modestly bearish. (87.4 calls for every 100 puts) So traders are spooked, but not freaked out. On a scale of 1-10, with 1 being max bearish and 10 being max bullish, I’d say we’re at a 3. Panic is not here… yet.
Continue Reading -->The Morning Hammer: Round 2 for the Bears!
Friday was the first -1% down day in the SPX since June 27 — and it was an ugly one. The SPX and Nasdaq each fell -2.5% while the Russell 2000 dropped -3.1%. And the VIX spiked an incredible 40% to 17.56. Many traders blamed the initial weakness on hawkish comments from Boston Fed President Eric Rosengren, who is a voting member of the Federal Open Market Committee. That obviously impacted the lousy action in US Treasuries and gold, but didn’t seem to fully explain the broader downturn in the market. Crude was slumping and the ECB disappointed, but to me the real factor was time. Volatility is mean-reverting and after an extended period of failures, the bears were due for a victory. The news is the justification after the drop — not the cause of the drop itself. As my friend Jeff Cooper says, “the news breaks with the cycles.” We’re seeing some follow-through this morning. European and Asia markets are off. WTI crude is down -2.4% to $44.80, breaking its 50 day moving average. The yen is soaring. German bunds and US Treasuries are falling. Gold is getting hit. SPX futures are down -0.7%, which doesn’t exactly spell disaster, but it’s clear that traders are feeling very, very spooked about what’s to come this week. SPX sliced through the key 2147 level Friday, and it’s below the 20/50 day moving averages. The 200 day is below at 2057. The 2090-2120 range looks key short-term. I really wonder what happens at the open: I wonder if traders will dump in the hopes of avoiding a catastrophe. Full disclosure: I have a position in VIX calls and that makes chaos my friend. Traders seem to be worried about Democratic Presidential candidate Hillary Clinton’s pneumonia scare, which could presumably help Donald Trump’s chances. In fact, the Mexican peso, which has been tracking Donald Trump’s perceived odds of winning, is down on this news today! BofAML actually issued a note today saying the market is not paying sufficient attention to Trump, who has been moving up in battleground states. The market is largely assuming a Clinton victory (which partially explains the weakness in biotech). I believe Trump has a better chance of winning than most people assume, and I would not count him out until the votes are tallied.
Continue Reading -->The Morning Hammer: Maybe the Fed Went Too Far
One key trend we’ve been pointing out here again and again has been the degrading trend in US economic data, culminating in yesterday’s trio of misses. Now all of a sudden, the market’s thinking that maybe the Fed went too far in pushing its rate hike case because we’ve seen such lousy data as of late. Traders are now pricing in a 52% chance of a December rate hike, down from 60% last week. September odds are down to 24% from 34% last week. Gold has been on a rampage while the dollar’s taking heat. Equities of course, are still going nowhere. SPX volatility is at a near 2-year low. We haven’t had a 1% SPX move since July 8, and we haven’t had a 1% down down day since June 27. I’m long VIX calls, so I have good reason to be bitter. But I’m also just plain bored out of my mind. Individual stocks are moving around nicely, but I’d love to see a little excitement in the broader indices. Chipotle (CMG) is up this morning on news that Bill Ackman’s Pershing Square took a 9.9% position. Ackman’s going after the board to shake things up. Grovery chain Sprouts Farmers Market (SFM) cut its earnings outlook on competitive pressures and ongoings deflation. Whole Foods (WFM) is down in sympathy with it, The economic calendar is pretty light with no market-moving reports, so it looks like we’ll be in a holding pattern today ahead of tomorrow morning’s ECB rate decision. Good luck… staying awake, that is.
Continue Reading -->Jobs Report Preview: Is Volatility About to Explode?

The nonfarm payrolls report is always one of the biggest events of the month, and with traders thinking the Fed is about to raise rates, tomorrow’s August report is no exception. Here is a list of the consensus numbers: Change in Nonfarm Payrolls (Aug): exp. 180k, prior 255k Two-Month Payroll Net Revision (Aug): prior 18k Change in Private Payrolls (Aug): exp. 180k, prior 217k Change in Manufact. Payrolls (Aug): exp. -4k, prior 9k Unemployment Rate (Aug): exp. 4.80%, prior 4.90% Average Hourly Earnings MoM (Aug): exp. 0.20%, prior 0.30% Average Hourly Earnings YoY (Aug): exp. 2.50%, prior 2.60% Average Weekly Hours All Employees (Aug): exp. 34.5, prior 34.5 Change in Household Employment (Aug): prior 420 Labor Force Participation Rate (Aug): prior 62.80% Underemployment Rate (Aug): prior 9.70% Source: Bloomberg Today, the US dollar is down on profit-taking following the weaker-than-expected Markit US Manufacturing PMI,ISM Manufacturing, and Construction Spending numbers. But it’s been had a nice bounce since the Fed hawks came out in force to prepare the market for additional rate hikes. So presumable, traders are gearing up for a repeat of the big July jobs report, which was an impressive across-the-board beat. I’ve been waiting for an explosion in volatility, and it could come soon. To be clear, I’m long VIX calls so I have a vested interest in the market falling hard. But volatility is mean reverting, and tension is slowly returning to the tape. Of course, trying to time those reversions is incredibly difficult! But let’s look at the backdrop. The S&P 500 hasn’t had a 1% move since July 8, and the last 1% down day was on June 27 — the day after the Brexit. July and August was a total snoozefest, but cracks are appearing in the mirror: 1) The S&P 500 broke its 8 and 21 day moving averages, which means a loss of short-term momentum. 2) Crude oil is dropping like a rock. 3) Biotech is sagging, with IBB on the verge of breaking its 50 day moving averages. To be fair, over the past 2 months, the bears have failed at every possible turn. But a miss on tomorrow’s jobs numbers will likely reverse many of the recent big trades. Namely, I would expect the gold miners (GDX) to explode higher with a selloff in broader equities that drives the VIX up big. And if we see an in-line report or a small beat, there’s a decent chance of a “sell the news” reaction that gives the same result — strong gold, weak broader equities — albeit on a smaller scale. I’d imagine that it would require an enormous beat to drive the rate hike narrative — and associated trades like long USD/short gold — any further.
Continue Reading -->The Morning Hammer: Let’s Eat Some Dove Soup
Traders are buying into the Fed’s hawkish narrative. On Friday, FOMC Chair Janet Yellen very clearly put rate hikes on the table, and market are buying in. Fed Funds futures now imply a 65% chance of a December rate hike, up from 47% a week ago. And September is up to 42% This has gold and silver slightly offf and the dollar up huge Overnight, Italian business manufacturing missed expectations, as did Greek GDP, Swedish retail sales, and Hong Kong retail sales. Australian home sales were also weak. European equity markets are red, while SPX futures are flat. We’ve got some important economic data today, with personal income/spending, PCE deflator, and Dallas Fed numbers on tap. Even though the Fed’s signalling pretty hard that rate hikes are en route, folks will be watching the PCE deflator closely since it’s the Fed’s preferred inflation indicator. If it’s strong, I’d assume folks push those rate hike odds up even more, and we could probably see an intraday selloff in US Treasuries (which are up fractionally in the early going). Beyond that, it looks like we’re going to close out August the way we came in — quietly. The VIX has been ticking up after putting in what looks like a major low on August 8, but we’re still not seeing much actual movement. We haven’t had a 1% down day in SPX since June 27. And it feel slike the more people look for one, the less likely it is to happen. Volatility is mean reverting. Things go crazy, and then they get quiet. And things get quiet, and then they go crazy. This quiet period today though, it’s one for the ages. I just wanna wake up, you know?
Continue Reading -->T3’s Take 3: Janet Yellen Sets Off a Rollercoaster
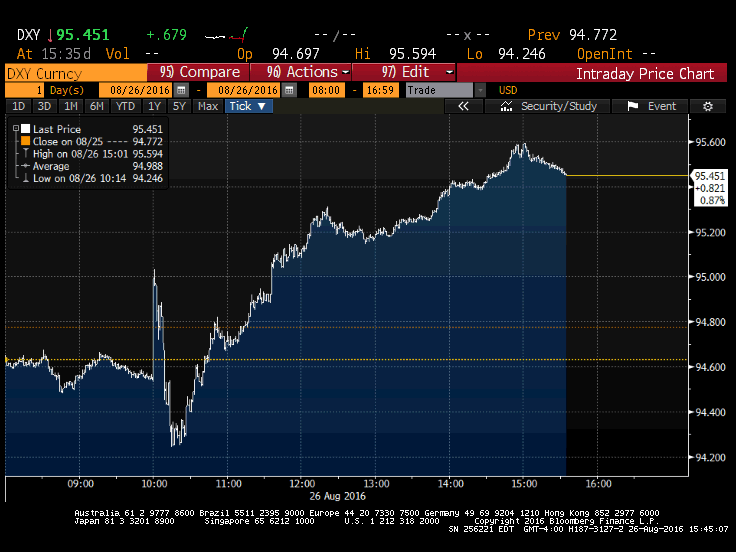
1) Fed Follies: Jackson Hole Edition Traders were looking for a hawkish Yellen and a hawkish Yellen is what they got. At her highly-awaited Jackson Hole speech, Federal Reserve Chair Janet Yellen said that the case for rate hikes “has strengthened in recent months,” echoing recent hawkish comments from other Fed officials. Initially, the market made the obvious moves — the US dollar spiked, and gold and US Treasuries collapsed. However, the moves were very quickly retraced, with the dollar and gold falling. This implied the market was having a massive “sell the news” reaction to Yellen meeting market expectations. 2) The Reaction to the Reaction to the Reaction Following that counter-reaction, the big hawk trade — strong dollar and weak gold/bonds — continued. Here is an intra-day chart of the US dollar index starting at 8:00 a.m. ET, which is a pretty good illustration of the market reaction to Yellen’s speech: As you can see, the dollar briefly dove before skyrocketing into the equity market close. We saw similar zaniness in gold and US Treasuries. 3) Equity Traders Take a Little Ride Fed funds futures now imply a 63% probability of a December rate hike, up from 47% a week ago. The prospect of higher rates had equity traders taking profits. At one point, the S&P 500 looked like it may have its first 1% down day since June 27, and the VIX hit 14.93, a level not seen since early July. However, stocks crawled up into the close, with the index finishing down -0.2% at 2169.04. Stocks that benefit from lower interest rates, like utilities, gold miners, and real estate names, took major hits. On the plus side, biotechnology had a solid up day after afternoon failures on Wednesday and Thursday. P.S. Want to up your trading skills? Check out our free webinars! Monday’s Trading Calendar US Economics (Time Zone: EDT) 08:30 Personal Income (Jul): exp. 0.40%, prior 0.20% 08:30 Personal Spending (Jul): exp. 0.30%, prior 0.40% 08:30 Real Personal Spending (Jul): exp. 0.20%, prior 0.30% 08:30 PCE Deflator MoM (Jul): exp. 0.00%, prior 0.10% 08:30 PCE Deflator YoY (Jul): exp. 0.80%, prior 0.90% 08:30 PCE Core MoM (Jul): exp. 0.10%, prior 0.10% 08:30 PCE Core YoY (Jul): exp. 1.50%, prior 1.60% 10:30 Dallas Fed Manf. Activity (Aug): exp. -3, prior -1.3 Global Economics All Day GBP Bank Holiday 19:30 JPY Household Spending y/y 21:30 AUD Building Approvals m/m Earnings Before Open: None of significance After Close: None of significance
Continue Reading -->